 Global| Oct 28 2008
Consumer Confidence Collapses To Record Low
by:Tom Moeller
|in:Economy in Brief
Summary
Reflecting turbulence in the financial markets, the Conference Board reported that its October index of consumer confidence collapsed by more than one-third m/m to a record low level. The latest index level of 38.0, off by two-thirds [...]

Reflecting turbulence in the financial markets, the Conference Board reported that its October index of consumer confidence collapsed by more than one-third m/m to a record low level. The latest index level of 38.0, off by two-thirds from last year, followed a level of 61.4 during September. Consensus expectations had been for a lesser m/m decline to a reading of 52.0.
During the last ten years there has been a 79% correlation between the level of consumer confidence and the y/y change in real consumer spending.
This month's decline reflected a 42.3% m/m plunge in the
expectations component of the index. The index was at a record low
level and the October drop followed increases during the prior three
months.
Fewer jobs were seen by 41.5% of respondents, the highest since 1980. Only 4.4% planned to buy an automobile and just 3.3% planned to buy carpet. Both of these percentages set the record low for the series. Twenty six percent of respondents planned to buy a major appliance within six months, near the fifteen year low. Only 2.7% of respondents planned to buy a home within six months, down from the high near 5% in 1999.
The percentage of respondents expecting business conditions to worsen in six months jumped to 36.6%, the highest level since the credit crunch of 1980. Only 9.9% expected improvement in conditions.
Down by nearly one-third m/m, the present conditions index fell to the lowest level since 1992. Jobs were seen as hard to get by 37.2% of respondents, the highest since 1993 and jobs were seen as plentiful by just 8.9%. Business conditions were seen as good by just 9.2%, the lowest since 1991. Those who thought it bad rose to 38.3%, also the highest since 1992.
Expectations for the inflation rate in twelve months surprisingly rose to 6.9%, the highest level since July.
The Enduring Challenge of Concentrated Poverty: Case Studies from Communities Across the U.S. from the U.S. Federal Reserve Board is available here.
| Conference Board (SA, 1985=100) | October | September | Y/Y % | 2007 | 2006 | 2005 |
|---|---|---|---|---|---|---|
| Consumer Confidence Index | 38.0 | 61.4 | -60.1 | 103.4 | 105.9 | 100.3 |
| Present Situation | 41.9 | 61.1 | -64.5 | 128.8 | 130.2 | 116.1 |
| Expectations | 35.5 | 61.5 | -55.6 | 86.4 | 89.7 | 89.7 |
by Tom Moeller October 28, 2008
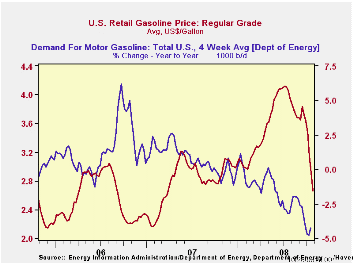
The retail price for a gallon of regular gasoline fell by twenty five cents last week. At $2.66 per gallon, according to the U.S. Department of Energy survey, the price was the lowest since March of 2007. Prices have now fallen roughly $1.50 per gallon, or by one-third, since their peak early this past July. The latest decline was accompanied by a drop in the average price for all grades of gasoline to $2.72 per gallon.
Yesterday, the spot market price for a gallon of regular
gasoline
fell further to $1.60, down twenty cents from last week's average. In
futures trading the November contract closed down further at $1.48 per
gallon.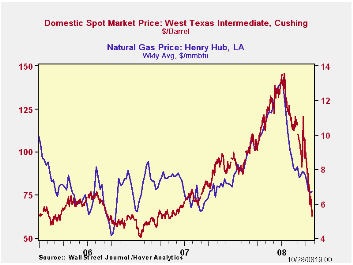
Weekly gasoline prices can be found in Haver's WEEKLY database. Daily prices are in the DAILY database.
In reaction to the general slowing of U.S. economic growth and relatively high prices, the demand for gasoline is down. The 4.2% y/y decline, according to the U.S. Department of Energy, was the largest y/y drop since late 1995 (the latest four weeks versus the same four weeks last year).
These DOE figures are available in Haver's OILWKLY database.
The price for a barrel of West Texas Intermediate crude oil fell sharply last week to an average $68.16 per barrel, down by more than one half from the high in July of $145.66. In futures trading, the two-month price for crude oil was down further yesterday at $63.71 per barrel.
Last week prices for natural gas were near their lowest level since August of last year. At an average $6.73 per mmbtu, prices ticked up slightly from the prior week but the average price this month was nearly one-half below the high for natural gas prices in early-July of $13.19/mmbtu.
| Weekly Prices | 10/27/08 | 10/20/08 | Y/Y | 2007 | 2006 | 2005 |
|---|---|---|---|---|---|---|
| Retail Regular Gasoline ($ per Gallon) | 2.66 | 2.91 | -7.5% | 2.80 | 2.57 | 2.27 |
| Light Sweet Crude Oil, WTI ($ per bbl.) | 68.18 | 75.21 | -23.9% | 72.25 | 66.12 | 56.60 |
by Tom Moeller October 28, 2008
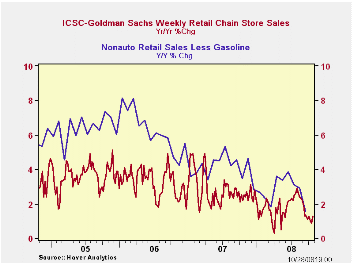
Consumer spending continued to weaken this month, according to the International Council of Shopping Centers-Goldman Sachs Index, chain store sales recovered just a piece of the prior week's decline. The 0.5% increase came after a 1.6% drop keeping October sales 1.1% below the September average. Chain store sales fell 1.9% during August.
The level of sales during the latest week remained near the lowest since December of last year.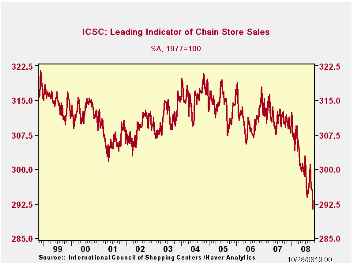 During the last ten years there has been a 59%
correlation between the y/y change in chain store sales and the change
in nonauto retail sales less gasoline.
During the last ten years there has been a 59%
correlation between the y/y change in chain store sales and the change
in nonauto retail sales less gasoline.
The ICSC-Goldman Sachs retail chain-store sales index is constructed using the same-store sales (stores open for one year) reported by 78 stores of seven retailers: Dayton Hudson, Federated, Kmart, May, J.C. Penney, Sears and Wal-Mart.
Portending further weakness in consumer spending was a 1.3% drop in the leading indicator of chain store sales from ICSC-Goldman Sachs. It fell 1.3% (-5.8% y/y) during the latest week to the lowest level since 1996.
The chain store sales figures are available in Haver's SURVEYW database.
| ICSC-UBS (SA, 1977=100) | 10/25/08 | 10/18/08 | Y/Y | 2007 | 2006 | 2005 |
|---|---|---|---|---|---|---|
| Total Weekly Chain Store Sales | 479.3 | 477.0 | 1.3% | 2.8% | 3.3% | 3.6% |
by Tom Moeller October 28, 2008
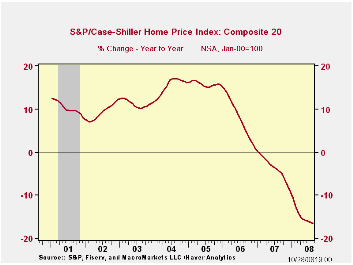
The S&P/Case-Shiller Composite 20 Home Price Index fell another 1.0% in August which about matched the July drop. Since their peak in July 2006 prices have fallen 20.0% -- down 16.6% during the last twelve months. The series dates back only to 2000. The decline in August prices was as expected.
The Case-Shiller index of 20 U.S. cities and their surrounding areas is weighted to reflect price changes due to extensive remodeling, home additions or extreme neglect. For example, smaller weights are assigned to sales of homes that have undergone extensive remodeling.
The Case-Shiller composite index of homes in 10 metropolitan
areas,
which has a longer history and dates back to 1987, fell 1.1% in August,
the same as during July. The index was down 17.7% year-to-year.
Home prices in Phoenix, Nevada continued quite weak and fell 2.9% during August (-30.7% y/y) and in San Diego prices fell 2.3% (-25.8% y/y). Home prices in Las Vegas, Nevada were down 2.4% (-30.6% y/y), about as they were in July. Prices in Miami also repeated their August performance and fell 1.8% (-28.1% y/y) while the same was true for home prices in Los Angeles, down 26.7% y/y. In San Francisco home prices were off 27.3% y/y and prices in Tampa, Florida posted an 18.1% y/y decline.
In the Northeast home prices have held up relatively well. In New York prices fell a lesser 6.9% y/y and they were down 4.7% in Boston. In Dallas prices also were off a modest 2.7% y/y and by 2.8% in Charlotte, North Carolina. In Denver home prices were off 5.1% y/y and they were down 6.6% in Cleveland Ohio.
The S&P/Case-Shiller home price series can be found in Haver's USECON database but the city data is in the REGIONAL database.
The latest press release from Standard & Poor's can be found here.
An overview of the S&P/Case-Shiller home price series can be found here.
| S&P/Case-Shiller Home Price Index (NSA, Jan 00 = 100) | August | July | Y/Y | 2007 | 2006 | 2005 |
|---|---|---|---|---|---|---|
| 20 City Composite Index | 164.57 | 166.29 | -16.6% | -3.8% | 7.6% | 15.8% |
by Louise Curley October 28. 2008
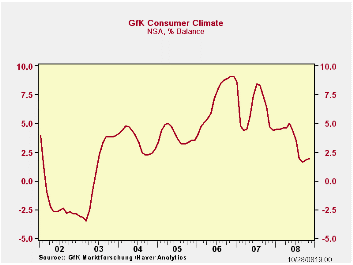
In spite of the continued financial and economic turmoil, the German consumer's appraisal of the Consumer Climate improved slightly in October from a percent balance of 1.6% in September to 1.8% and is expected to increase to 1.9% in November. These data are from the Gfk Consumer Climate Survey that Haver Analytics recently addedto the GERMANY, G10 and INTSRVYS data bases.
The consumer climate indicator has varied in a relatively
narrow
band. It reached a low of -3.5% in March of 2003 and a high of 9.1% in
November and December of 2006, as can be seen in the first chart.
Optimistic German consumers rarely exceed the pessimists by anything
but a small margin.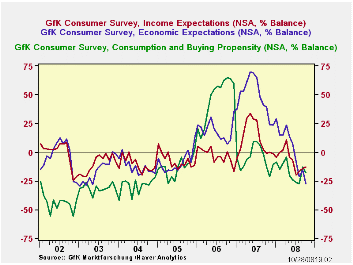
There are three factors influencing the overall climate: income expectations, economic expectations and the consumption and buying propensity. These are shown in the second chart. Income expectations were slightly less negative in October than in September, -12.9% versus -14.1%. The decline in the oil price may have been a factor.
Both economic expectations and consumption and buying propensity became more negative: the former from -15.5% in September to -27.5% in October and the latter from -12.8% to -18.2%.Partly accounting for the sharp decline in the appraisal of the economic situation may have been the timing of the survey. At the time of the survey, the government had not agreed upon its financial rescue package of 80 billion euro in fresh capital and 400 billion euro in loan guarantees to the banks. As a result the measure, the aim of which was to restore confidence in the financial markets, had no positive effect on consumer's appraisal of the economic outlook. Consumer's propensity to buy became more negative in October after have become much less negative in September than in August. Consumers are, however, less reluctant to buy than they were in July and August.
| GERMANY Gfk Consumer Climate (% balance) | Nov 08 | Oct 08 | Sep 08 | Aug 08 | Jul 08 | 2007 | 2006 | 2005 |
|---|---|---|---|---|---|---|---|---|
| Consumer Climate | 1.9* | 1.8 | 1.6 | 1.9 | 3.5 | 6.2 | 7.0 | 3.9 |
| Income Expectation | -- | -12.9 | -14.1 | -16.8 | -20.0 | 11.9 | -2.9 | -7.4 |
| Economic Expectation | -- | -27.5 | -15.7 | -21.8 | -8.0 | 48.7 | 18.8 | -9.12 |
| Consumption and Buying Propensity | -- | -18.2 | -12.8 | -27.9 | -26.2 | -5.6 | 46.2 | -13.4 |
| * Forecast |
by Robert Brusca October 28. 2008
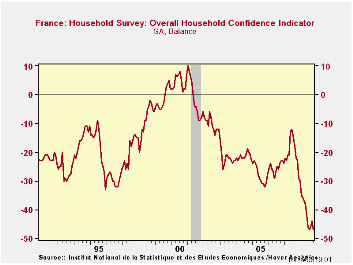
French VS German Consumers - Germans are acting more stoically in this period, but French consumers are admitting to really feeling a pinch. The German look-ahead survey for November from GFK found a slight pick up – very slight – in German consumer confidence. French consumers could not match this resilience. The French figures are more conventional for October instead of leaping ahead to November as with Germany’s GfK poll. They show a relatively sharp slip to -47 in the French INSEE Climate index from -44 in September. This matches the all-time low (since 1990) and the low reached in July of this year. Placed in their respective ranges for percentile standings the French readings are uniformly low or much worse than that.
Living standards…or sub-standards. Past and next 12 months living standards are about the weakest ever seen. Unemployment prospects are at the top FOUR percent of their historic range and have escalated sharply and steadily July to August to Sept to Oct.
Inflation and spending plans. Expected prices developments show inflation pressures and expectations for inflation are cooling. Saving or the ability to save is rated very low by the responding French households. The spending climate is in the bottom five percent of its range but has eroded very little in the past four months.
And…the financial situation is…The current financial situation is rated as a bottom 30% environment with the past rated as a bottom 12% environment and the future 12 months rated as a bottom 3% environment. That is not good news.
| INSEE Household Monthly Survey | ||||||||||
|---|---|---|---|---|---|---|---|---|---|---|
| Since Jan 1990 | Since Jan 1990 | |||||||||
| Oct 08 |
Sep 08 |
Aug 08 |
Jul 08 |
Prcntile | Rank | Max | Min | Range | Mean | |
| Household Confidence | -47 | -44 | -46 | -47 | 0.0 | 225 | 10 | -47 | 57 | -18 |
| Living Standards | ||||||||||
| Past 12 months | -82 | -80 | -81 | -82 | 0.0 | 225 | 18 | -82 | 100 | -38 |
| Next 12 months | -59 | -50 | -55 | -60 | 1.3 | 225 | 15 | -60 | 75 | -20 |
| Unemployment: Next 12 | 69 | 52 | 45 | 39 | 96.4 | 5 | 73 | -37 | 110 | 30 |
| Price Developments | ||||||||||
| Past 12 months | 36 | 44 | 52 | 60 | 76.9 | 11 | 64 | -57 | 121 | -16 |
| Next 12 months | -38 | -53 | -41 | -30 | 24.2 | 129 | 31 | -60 | 91 | -34 |
| Savings | ||||||||||
| Favorable to save | -7 | 16 | 17 | 17 | 0.0 | 226 | 40 | -7 | 47 | 23 |
| Ability to save Next 12 months | -22 | -16 | -19 | -20 | 3.4 | 225 | 6 | -23 | 29 | -9 |
| Spending | ||||||||||
| Favorable for major purchase | -39 | -37 | -38 | -38 | 5.2 | 225 | 16 | -42 | 58 | -13 |
| Financial Situation | ||||||||||
| Current | 8 | 8 | 7 | 7 | 23.8 | 172 | 24 | 3 | 21 | 12 |
| Past 12 months | -32 | -34 | -35 | -36 | 12.9 | 221 | -5 | -36 | 31 | -17 |
| Next 12 months | -22 | -18 | -20 | -21 | 2.9 | 225 | 11 | -23 | 34 | -1 |
| Number of observations in the period: 226 | ||||||||||

Tom Moeller
AuthorMore in Author Profile »Prior to joining Haver Analytics in 2000, Mr. Moeller worked as the Economist at Chancellor Capital Management from 1985 to 1999. There, he developed comprehensive economic forecasts and interpreted economic data for equity and fixed income portfolio managers. Also at Chancellor, Mr. Moeller worked as an equity analyst and was responsible for researching and rating companies in the economically sensitive automobile and housing industries for investment in Chancellor’s equity portfolio. Prior to joining Chancellor, Mr. Moeller was an Economist at Citibank from 1979 to 1984. He also analyzed pricing behavior in the metals industry for the Council on Wage and Price Stability in Washington, D.C. In 1999, Mr. Moeller received the award for most accurate forecast from the Forecasters' Club of New York. From 1990 to 1992 he was President of the New York Association for Business Economists. Mr. Moeller earned an M.B.A. in Finance from Fordham University, where he graduated in 1987. He holds a Bachelor of Arts in Economics from George Washington University.
More Economy in Brief


