 Global| Dec 28 2005
Consumer Confidence Buoyed By More Jobs & Lower Gas Prices
by:Tom Moeller
|in:Economy in Brief
Summary
The December index of Consumer Confidence surged 5.4% to 103.6 on top of a 15.4% recovery the prior month, reported the conference Board. The index stood at the highest level since August and exceeded Consensus expectations for a [...]
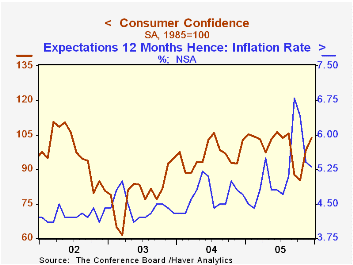
The December index of Consumer Confidence surged 5.4% to 103.6 on top of a 15.4% recovery the prior month, reported the conference Board. The index stood at the highest level since August and exceeded Consensus expectations for a lesser gain to 102.3. The gain lagged a bit the 12.1% m/m jump in Consumer sentiment reported last week by the University of Michigan.
During the last twenty years there has been a 52% correlation between the level of consumer confidence and the y/y change in real consumer spending. The correlation rose to 66% during the last ten years.
The index of consumers' expectations added 3.6% (-9.0% y/y) to the 26.1% m/m spike during November. Optimism rose that more jobs would be created and that the inflation rate during the during the next year would ease.
Consumers' assessment of the present situation rose 7.3% (14.9% y/y) on top of a 5.0% increase during November. Jobs were viewed as plentiful by 23.3% of respondents, the highest since August and fewer (22.2%) thought jobs were hard to get, the lowest since 2002.
The Conference Board’s survey isconducted by a mailed questionnaire to 5,000 households and about 3,500 typically respond.
| Conference Board | Dec | Nov | Y/Y | 2005 | 2004 | 2003 |
|---|---|---|---|---|---|---|
| Consumer Confidence | 103.6 | 98.3 | 0.9% | 100.3 | 96.1 | 79.8 |
by Tom Moeller December 28, 2005
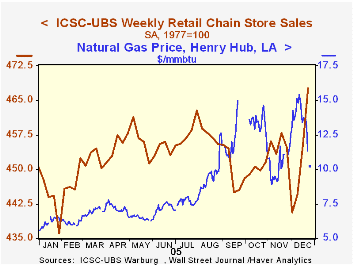
Chain store sales added 2.8% last week to the 2.4% jump during the week prior according to the International Council of Shopping Centers (ICSC)-UBS survey.
The two increases did much to rescue the December average from an abysmal start when sales fell 3.1% during the opening week. As a result the month's average is down just 0.8% from November which rose 1.2% from October.
During the last ten years there has been a 51% correlation between the y/y change in chain store sales and the change in non-auto retail sales less gasoline, as published by the US Census Department. Chain store sales correspond directly with roughly 14% of non-auto retail sales less gasoline. Lower gasoline prices may have added to consumers' Holiday spirit. Retail gas prices fell a penny to $2.20 per gallon (22.7% y/y) last week after two weeks of moderate increase. Natural gas prices also backed off a bit after five weeks of strong gain although they were still roughly double last year's level. Further declines in gasoline & natural gas prices were evident in yesterday's spot market trading when gasoline ended down four cents from the week prior. Warmer weather helped lower natural gas prices roughly $3/mmbtu or 22% to the lowest level since mid-November.The ICSC-UBS retail chain-store sales index is constructed using the same-store sales (stores open for one year) reported by 78 stores of seven retailers: Dayton Hudson, Federated, Kmart, May, J.C. Penney, Sears and Wal-Mart.
| ICSC-UBS (SA, 1977=100) | 12/24/05 | 12/17/05 | Y/Y | 2004 | 2003 |
|---|---|---|---|---|---|
| Total Weekly Chain Store Sales | 467.6 | 455.0 | 3.9% | 4.6% | 2.9% |
by Tom Moeller December 28, 2005
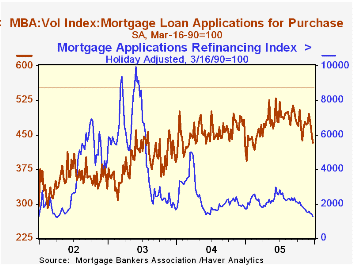
The total number of mortgage applications fell a hard 6.8% last week to the lowest level since mid-2002 and pulled the average level during December down 6.0% from November.
Purchase applications were notably weak, again. The 4.5% w/w drop was the third consecutive weekly hard decline and was to the lowest level since mid-February. The December average of purchase applications was off 1.7% from November.
During the last ten years there has been a 50% correlation between the y/y change in purchase applications and the change in new plus existing single family home sales
Applications to refinance were even weaker. An 11.2% w/w plunge pulled the December average 13.0% below November.
The effective interest rate on a conventional 30-year mortgage was steady at 6.44% versus 6.45% the prior week. Rates averaged 6.52% in November and averaged 5.81% in June. The effective rate on a 15-year mortgage also was steady at 6.06%. The interest rates on 15 and 30 year mortgages are closely correlated (>90%) with the rate on 10 year Treasury securities.
The Mortgage Bankers Association surveys between 20 to 35 of the top lenders in the U.S. housing industry to derive its refinance, purchase and market indexes. The weekly survey accounts for more than 40% of all applications processed each week by mortgage lenders. Visit the Mortgage Bankers Association site here.
| MBA Mortgage Applications (3/16/90=100) | 12/23/05 | 12/16/05 | Y/Y | 2004 | 2003 | 2002 |
|---|---|---|---|---|---|---|
| Total Market Index | 554.1 | 594.6 | -18.2% | 735.1 | 1,067.9 | 799.7 |
| Purchase | 432.9 | 453.1 | -10.5% | 454.5 | 395.1 | 354.7 |
| Refinancing | 1,259.1 | 1,418.1 | -30.2% | 2,366.8 | 4,981.8 | 3,388.0 |
by Carol Stone December 28, 2005
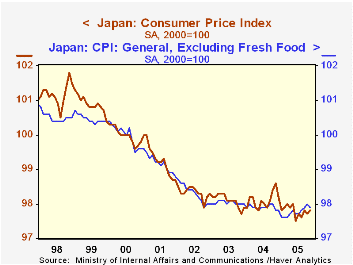
Japan's Statistics Bureau in the Ministry of Internal Affairs and Communications (MIC) yesterday reported consumer prices for November. Generally, these prices seem to be working their way into an upturn, but the extent of this firming trend depends on the price measure being applied and what time comparison is being used.
The total index, the so-called General CPI, continues to decline on a year-over-year basis. In November it was 0.8% below November 2004, the weakest change since October 2002. Seasonally adjusted and compared month-to-month, however, it looks to be stabilizing: it has actually increased from 97.5 in June to November's 97.8.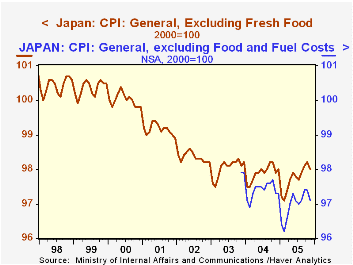
As in many other countries, a "core" rate is used for government policymaking and investment planning. Core rates are supposedly less volatile that total indexes and are defined to exclude items where supply forces predominate. So their movements reflect such non-economic events as bad weather, war and possibly political priorities, not so much market influences. Up to now in Japan, the "core" has been the general index less fresh food. This latter item is clearly more subject to weather and seasonal forces than to consumer demand pressures. The subset of the CPI excluding fresh food has been deemed the most useful for monetary policy focus. Thus, yesterday [overnight in Western markets between Monday and Tuesday] the November report made news when this core index rose on a year-to-year basis for the first time since October 2003 and for only the second time since the spring of 1998. On a month-to-month basis, this index too has been rising over the course of this year, suggesting that the year-to-year pattern could stay positive. At least one news account reported that some investors were beginning to look for a change in the Bank of Japan's current "quantitative monetary easing" as this price trend might be sustained during 2006.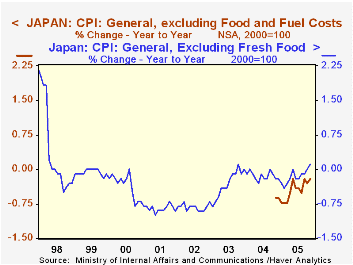
At the same time, with this release, the MIC has introduced still another core rate, one similar to those used elsewhere which exclude both food and energy products. Haver Analytics added this new series to the JAPAN database just this morning. Only two years of history are available, running back to November 2003, so these data are not yet seasonally adjusted. This price measure is still going down. In the month from October, the index fell from 97.4 to 97.1, which in turn is off 0.2% from November 2004. The earliest levels, in November and December 2003, were 97.9. So it appears that the pick up in the standard core rate may be due to energy, and when that is excluded, general prices remain soft. Among various "subgroups" of prices, clothing has risen for well over a year and furniture has edged up just the last three months. Housing costs and reading and recreation appear to be stabilizing after long downward paths. Thus, while the pace of deflation has surely slowed, it is hard to read any threat of renewed inflation into this price behavior.
At the same time, the Japanese economy itself is firming. Today, for example, METI reported that industrial production for November was up 1.4% from October, a fourth consecutive monthly advance after some hesitation in the spring and early summer. So forces may be developing for more sustainable growth and firmer prices in Japan, but the mixed behavior of the various CPI measures leaves implications for monetary policy fairly vague at the present time.
| Japan CPI (2000=100) | Nov 2005 | Oct 2005 | Sept 2005 | Year Ago | 2004 | 2003 | 2002 |
|---|---|---|---|---|---|---|---|
| General CPI, SA | 97.8 | 97.7 | 97.8 | 98.6 | 98.1 | 98.1 | 98.3 |
| Yr/Yr % Change, NSA | -0.8 | -0.7 | -0.3 | -0.0* | -0.3* | -0.9* | |
| Gen CPI ex Fresh Food, SA | 97.9 | 98.0 | 97.9 | 97.8 | 97.9 | 98.0 | 98.3 |
| Yr/Yr % Change, NSA | 0.1 | 0.0 | -0.1 | -0.1* | -0.3* | -0.8* | |
| Gen CPI ex Food & Fuel, NSA | 97.1 | 97.4 | 97.4 | 97.3 | 97.4 | [97.9**] | -- |
| Yr/Yr % Change, NSA | -0.2 | -0.3 | -0.2 | -0.6* | -- | -- |

Tom Moeller
AuthorMore in Author Profile »Prior to joining Haver Analytics in 2000, Mr. Moeller worked as the Economist at Chancellor Capital Management from 1985 to 1999. There, he developed comprehensive economic forecasts and interpreted economic data for equity and fixed income portfolio managers. Also at Chancellor, Mr. Moeller worked as an equity analyst and was responsible for researching and rating companies in the economically sensitive automobile and housing industries for investment in Chancellor’s equity portfolio. Prior to joining Chancellor, Mr. Moeller was an Economist at Citibank from 1979 to 1984. He also analyzed pricing behavior in the metals industry for the Council on Wage and Price Stability in Washington, D.C. In 1999, Mr. Moeller received the award for most accurate forecast from the Forecasters' Club of New York. From 1990 to 1992 he was President of the New York Association for Business Economists. Mr. Moeller earned an M.B.A. in Finance from Fordham University, where he graduated in 1987. He holds a Bachelor of Arts in Economics from George Washington University.
More Economy in Brief


