 Global| Mar 30 2009
Commodity Prices Meander
by:Tom Moeller
|in:Economy in Brief
Summary
At best, the recent movement in commodity prices suggests that recessionary forces are diminishing. Prices for oil, copper and grains have stabilized after sharp declines in last year's second half. The price of gold has moved to the [...]
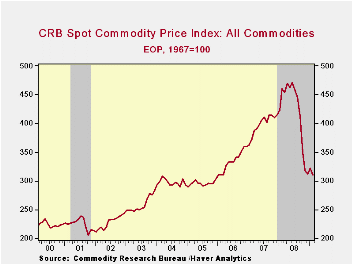
At best, the recent movement in commodity prices suggests that recessionary forces are diminishing. Prices for oil, copper and grains have stabilized after sharp declines in last year's second half. The price of gold has moved to the high end of the last year's range. Continued recovery in prices is dependent, of course, on whether worldwide economic recovery develops. So far, the move in commodity prices alone is not convincing.
Crude oil prices have shown some bottoming with the price of
WTI crude rising to $50 per barrel from the $40 low. But the case for a
turnaround is not strong. The recession in the U.S. industrial sector
and fewer car-miles driven have lowered the demand for all petroleum
products by 3.2% y/y after the 3.5% decline last year. And a pending
upturn is not yet signaled by various leading indicators. Inventory
decumulation rates are picking up steam and consumer sentiment remains
depressed. Abroad, recessionary forces are gaining steam. Industrial
output in Germany and France fell 11-12% through the end of last year
and production in Japan was off by roughly one quarter.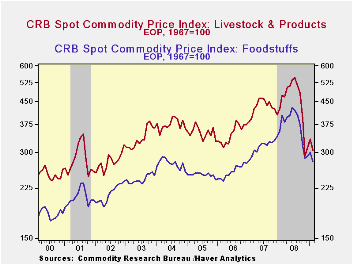
The worldwide recession also has taken its hold on industrial metals prices as factory sector output has fallen sharply. Prices for aluminum, stainless steel scrap and high grade copper are 50% lower than a year ago and the latest bottoming in copper prices is tentative, at best.An upturn in metals prices awaits recovery in global manufacturing sector activity.
Food prices have been mixed, with an upward trend. Wheat and corn prices recently recovered modestly after earlier sharp declines. Conversely, beef prices which showed signs of stability, have moved lower. The upward trend to prices overall derives from several global forces, notably economic development (upward income mobility) in the worlds' economies and government mandated bio-fuel standards.
Finally, gold prices have strengthened recently and they have
reached new highs of near $1,000 per ounce. Platinum and silver prices
have strengthen as well from the lows of last fall but they still are
down by 25% to 40% year to year.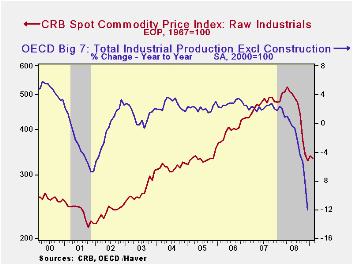
Overall, commodity prices have shown just a small effect on consumer price inflation. At most they account for one-third of the price of a particular product. It's as an indicator of demand that they are valuable. They are quite sensitive to changes in the supply-demand equation. As of yet they may be signaling that the U.S. recession was passed its worst stage. Factory sector output fell 5.4%, 9.2% then 17.4% (AR) through the first three quarters of 2008. OECD output in the big 7 nations similarly fell at a 3.5%, 6.8% then 21.8% rate in 2008.
The commodity price series in the table below can be found in Haver's WEEKLY database. The monetary and inflation figures cited above are available in USECON.
A Framework for Analyzing Bank Lending is today's speech by Fed Governor Elizabeth A. Duke and it can be found here.
The Risk of Deflation from the Federal Reserve Bank of San Francisco is available here.
| Commodity Prices | Latest Week | Y/Y | February | January | March '08 | 2008 | 2007 | 2006 |
|---|---|---|---|---|---|---|---|---|
| Industrial Metals | ||||||||
| Aluminum ($/lb.) | 0.64 | -50.4% | 0.99 | 0.63 | 1.34 | 1.18 | 1.18 | 1.18 |
| Stainless Steel Scrap ($/Ton) | 1,188 | -59.9% | 1,201 | -- | 2,893 | 2,121 | 2,786 | 2,918 |
| High Grade Copper ($/ton) | 1.80 | -51.4% | 1.50 | 1.51 | 3.77 | 1.31 | 3.06 | 3.04 |
| Foods | ||||||||
| Milk (Cents/lb.) | 85 | -34.6% | 85 | 84 | 132 | 86 | 172 | 145 |
| Beef Carcass (Index Value) | 126.6 | -4.3% | 127.0 | 136.2 | 135.3 | 134.6 | 139.3 | 134.1 |
| Corn, No. 2 Yellow ($/bushel) | 3.70 | -27.5% | 3.44 | 3.59 | 5.18 | 3.76 | 4.14 | 3.46 |
| Wheat, Soft Red ($/bushel) | 4.35 | -50.0% | 3.42 | 3.49 | 9.43 | 4.78 | 8.64 | 4.77 |
| Light Sweet Crude Oil, WTI ($/bbl.) | 49.46 | -53.3% | 39.05 | 41.72 | 105.78 | 100.16 | 72.25 | 66.12 |
| Gold, Handy & Harmon ($/oz.) | 923.75 | -0.3% | 941.63 | 856.38 | 972.06 | 869.75 | 810.5 | 628.7 |
by Louise Curley March 30, 2009
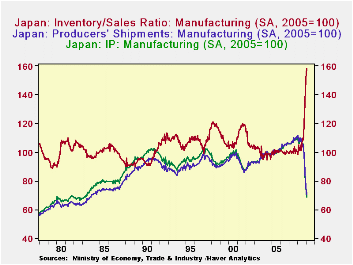
The Japanese index of industrial production in manufacturing
continued to fall sharply in February. The index with base 2005=100 was
68.8 down 9.5% from January and 27.8% below February, 2007.
Manufacturing production is now at levels last seen in the late
seventies and early eighties of the last century. The decline in the
production index has followed quickly on the declines in the index of
manufacturing shipments, but until the last two months, the index of
inventories continued to rise, resulting in a rising index of
inventory/sales ratio, as can be seem in the first chart. The index of
the inventory/sales ratio rose in January and February, as the declines
in shipments offset the declines in index of inventories.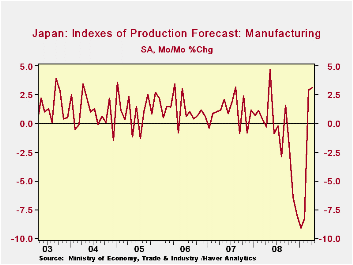
The index of manufacturing inventories showed a decline of 2.1% in January from December and one of 4.2% in February from January. Although these reductions seem small in percentage terms, the 4.2% drop was the biggest drop since 1978 when the record keeping began. With production at historical lows and now historically large reductions in inventories, manufacturers are apparently are beginning to see a need to increase production. and are currently forecasting increases in the index of industrial production for manufacturing in March and April of 2.8% and 3.1% respectively. The second chart shows their expectations.
| JAPAN MANUFACTURING (2005=100) | Feb 09 | Jan 09 | Feb 08 | M/M CHG | Y/Y CHG | 2008 | 2007 |
|---|---|---|---|---|---|---|---|
| Industrial Production | 68.6 | 75.8 | 110.2 | -9.50 | -37.75 | 103.9 | 107.4 |
| Shipments | 70.4 | 76.0 | 111.3 | -6.84 | -36.39 | 104.5 | 107.8 |
| Inventories | 103.7 | 108.2 | 105.4 | -4.16 | -1.61 | 106.7 | 103.9 |
| Inventory/sales Ratio | 158.2 | 151.4 | 99.8 | 4.49 | 60.94 | 108.7 | 100.4 |
by Robert Brusca March 30, 2009
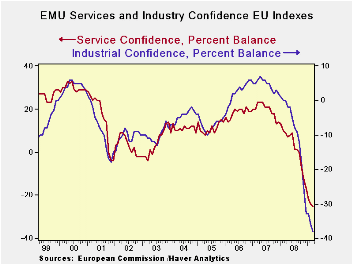
In the EMU framework it is pretty clear that things are not going very well. In the March report even though the Markit (formerly Reuter) PMIs had bottomed and risen, the similar gauges from the EU Commission show no such trend. Indeed, the EU Commission framework shows universal weakness and near universal worst case readings. The overall sentiment index as at a low as is the industrial measure, consumer confidence, and the service sector barometer. Above their lowest readings are the retail and construction sectors each of which is still in about the lower 10% of its respective range. And that’s as good as it gets - bottom 10% - a clear ‘F’ if we were grading.
Moreover, the overall sentiment gauges for EMU are at their lowest in EMU as a whole, in Germany and in Italy . The UK , an EU member, is also on a low. France and Spain are not at their respective all time (since 1985) lows, but are not far from them.
If we turn to the industrial sector details we find that most of the component readings are at or near all time lows except for inventories; they are in the top 10% of their range – not a good ‘top-10’ reading at all.
Consumer confidence is also at its all-time low although its components are not so universally at extremes. Still, the economic situation in the past 12-months and expectations for the next 12-months are each at all time lows. The environment for making major purchases now is only ‘only’ in the bottom 30% of its range. For the next 12months the reading is in the bottom 15% of its range, a bit worse that eh current reading: that is not good. Still the consumer does not seem as beleaguered as the industrial sector. German and French consumer responses are at all-time lows. Italy , the UK and Spain are, respectively, in the bottom 17th, 17th and 9th percent of their ranges.
With the consumers not being as impacted as badly as industry it is not surprising that the retail sector is ‘only’ in the bottom 10% of its range. Across the largest EMU/EU countries the results are even better. In France the responses are only in the bottom 63rd percentile of their range (top 37%!), Italy’s retail sector is in the bottom 34th percentile, Germany and Spain are in the lower 20th percentile and the UK is the weakest in the bottom 17th percentile.
The services sector has no bright spots or readings. The overall gauges for EU is at its all time low as are all its component readings; the main countries have readings that are at their all-time lows or quite near them.
Construction as a sector is in the lower 25th percentile of its range on an EU-wide basis. Across countries, Germany and Italy show near midpoint readings in construction; France is a 30th percentile reading; the UK is a bottom 25th percentile reading; Spain is a bottom 20 percentile reading.
Expected and current employment readings are at their worst or bottom 10% across the various sectors with the obvious exception of the expected unemployment reading which is at an all time high.
The EU/EMU is a still every weak region. It is not showing the upward momentum or abatement of downward momentum that is becoming increasingly common in the US . Its leaders are less active in implementing new stimulus programs, although in fairness, Europe in general has a better social safety-net than does the US . Still As I pointed out at the time of the Obama plan, ‘cushion’ is not ‘stimulus’.
| EU Sectors and Country level Overall Sentiment | R-SQ | ||||||||||
|---|---|---|---|---|---|---|---|---|---|---|---|
| EU | Mar 09 |
Feb 09 |
Jan 09 |
Dec 08 |
%tile | Rank | Max | Min | Range | Mean | w/ Overall |
| Overall | 60.3 | 60.9 | 63.2 | 66.6 | 0.0 | 220 | 116 | 60 | 56 | 99 | 1.00 |
| Industrial | -39 | -37 | -33 | -32 | 0.0 | 220 | 7 | -39 | 46 | -8 | 0.89 |
| Consumer Confid | -32 | -32 | -31 | -28 | 0.0 | 219 | 2 | -32 | 34 | -11 | 0.86 |
| Retail | -22 | -24 | -25 | -25 | 9.7 | 217 | 6 | -25 | 31 | -6 | 0.62 |
| Construction | -38 | -38 | -36 | -32 | 8.9 | 205 | 3 | -42 | 45 | -18 | 0.44 |
| Services | -31 | -29 | -28 | -23 | 0.0 | 145 | 32 | -31 | 63 | 15 | 0.87 |
| % m/m | Mar 09 |
Based on Level | Level | ||||||||
| EMU | -1.1% | -2.8% | -2.5% | 64.6 | 0.0 | 220 | 117 | 65 | 52 | 99 | 0.96 |
| Germany | -1.1% | -1.6% | -4.0% | 72.4 | 0.0 | 220 | 121 | 72 | 48 | 99 | 0.70 |
| France | -1.3% | -0.9% | -0.7% | 73.1 | 2.4 | 219 | 119 | 72 | 47 | 99 | 0.81 |
| Italy | -6.3% | -0.4% | -1.4% | 67.1 | 0.0 | 220 | 121 | 67 | 54 | 99 | 0.82 |
| Spain | 1.2% | -3.2% | 3.7% | 67.8 | 2.2 | 218 | 117 | 67 | 50 | 100 | 0.72 |
| Memo:UK | -0.7% | -6.3% | -10.9% | 56.0 | 0.0 | 220 | 117 | 56 | 61 | 100 | 0.58 |
| Since 1990 except Services (Oct 1996)247 | -Count | Services: | 145 | -Count | |||||||
| Sentiment is an index, sector readings are net balance diffusion measures | |||||||||||

Tom Moeller
AuthorMore in Author Profile »Prior to joining Haver Analytics in 2000, Mr. Moeller worked as the Economist at Chancellor Capital Management from 1985 to 1999. There, he developed comprehensive economic forecasts and interpreted economic data for equity and fixed income portfolio managers. Also at Chancellor, Mr. Moeller worked as an equity analyst and was responsible for researching and rating companies in the economically sensitive automobile and housing industries for investment in Chancellor’s equity portfolio. Prior to joining Chancellor, Mr. Moeller was an Economist at Citibank from 1979 to 1984. He also analyzed pricing behavior in the metals industry for the Council on Wage and Price Stability in Washington, D.C. In 1999, Mr. Moeller received the award for most accurate forecast from the Forecasters' Club of New York. From 1990 to 1992 he was President of the New York Association for Business Economists. Mr. Moeller earned an M.B.A. in Finance from Fordham University, where he graduated in 1987. He holds a Bachelor of Arts in Economics from George Washington University.
More Economy in Brief


