 Global| Nov 12 2008
Commodity Prices, Inflation and Expectations
by:Tom Moeller
|in:Economy in Brief
Summary
Weakening economic growth in the U.S. as well as in other industrial countries has sapped what had been, until early this past summer, pronounced strength in commodity prices. Since then, copper prices, corn prices, crude oil and [...]
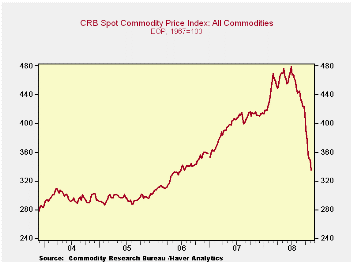
Weakening economic growth in the U.S. as well as in other industrial countries has sapped what had been, until early this past summer, pronounced strength in commodity prices. Since then, copper prices, corn prices, crude oil and wheat prices all are down roughly fifty percent from their highs. Showing a more moderate decline has been the price of beef which is off seven percent.
The implication of these declines will clearly be to moderate
future gains in consumer prices. However, not so much of a moderation
should be expected. Overall, commodity prices make up roughly twenty
five percent of the price of finished goods prices; more for foods but
less for industrial metals. The remaining input pressures on consumer
prices stem from labor and processing costs.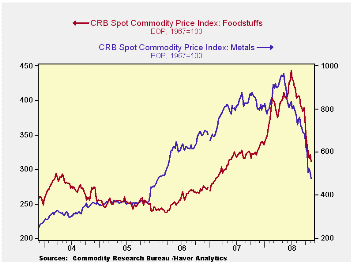
After rising to $142.46 per barrel this past July, WTI crude has since fallen 50% to roughly $70 per barrel. Prices have been most sensitive to the weakening in global economic growth. That weakness has been fostered by fewer miles driven in the U.S. where gasoline consumption is down 4% during the last year. Weaker oil demand is also the result of lower industrial production, off 4.5% y/y. Elsewhere, German factory production is down 0.5% y/y after 6.0% growth during 2007 and 2006; Japanese production is off 4.7% y/y after 3% to 4% gains the past two years; and French output is off 2.0% after rising 1% during the last two years.
Then there's the price of gold, reflecting global inflationary pressures. Near $700 per ounce, the price is down 30% after having momentarily touched $1,000 this past March and the price is off 6.7% y/y.
Industrial metals have weakened sharply with the weakness in
industrial economies around the world. The table below indicates that
aluminum prices are down 15% from their year ago level and they are off
by nearly one-third from their high this past Spring. Stainless steel
scrap prices also are off 11% during the last twelve months and they've
halved their 2007 high. Prices for high grade copper round out the
story of price weakness. They are down by more than one-half from their
high this past Spring.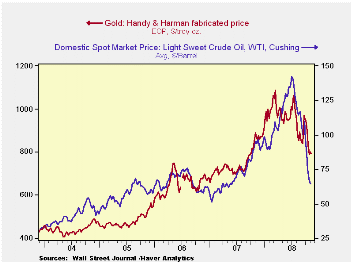
Food prices have shown a similar pattern of reversing past
strength, helped in part by a return of favorable growing weather.
Wheat prices are down by roughly one half from their year ago level and
the latest is off by two-thirds from this year's high. Milk prices
similarly have cratered, off by nearly one-half y/y. Egg prices (+11.2%
y/y) similarly are down by one-half from their highs earlier this year.
Even beef prices, which are receiving a lift from a thinning of herds
in recent years, are up 5% y/y but the price is off 9% from the high
this past July.All this weakness has yet to show up. however, in
consumer prices for food. They have been rising at a 6.0% y/y rate
after last year's increase of 4.0%. In contrast to the lower commodity
prices noted above, the price consumers paid for milk & dairy
products was up 4.9% y/y in September and meat prices were up 5.9%.
Processing and distribution costs of food account for most of the price
consumers pay -- and they have not fallen, only their rate of growth
has slowed.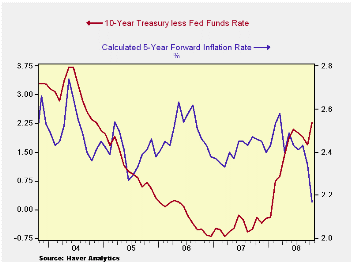
How does all this shake out for the U.S. economy as a whole? The Federal Reserve can take comfort from lower product prices as it eases monetary policy. Inflationary pressures generally are under control. The core CPI rose at a 2.5% year-to-date through September, roughly its growth rate over the last two years. Moreover, oil prices have more than halved their highs early their summer.
Inflationary psychology, however, is a different story. One measure of that psychology is the difference between the yield on long term U.S. treasury notes and the Federal funds rate. That difference has risen sharply over the last year. The markets are indicating a worry about future inflation. Growth in M2 recently rose to 6% y/y from its low of less than 4% during 2005. The monetary base has surged. Both have occurred as the Fed has provided liquidity to deal with the current crisis in the financial markets. Will this provision justify the concern about the potential for higher inflation? The monetary theorist would say "probably not," because the demand for money is collapsing. In fact, another direct measure of the market's inflation psychology is the implied forward inflation rate suggested in the market for Treasury Inflation-Indexed Securities (TIPS). It has dropped to 2.2% from 2.5% during 2006. Will a steep yield curve anticipating higher inflation eventually be reconciled with the decline in the forward rate in TIPS? Yes, but the direction of inflation will depend on how long the Fed keeps money easy after the current financial crisis is resolved.
The commodity price series in the table below can be found in Haver's WEEKLY database. The monetary and inflation figures cited above are available in USECON.
Creative Destruction and Aggregate Productivity Growth from the Federal Reserve Bank of Philadelphia can be found here.
Oil Prices and Inflation from the Federal
Reserve Bank of San Francisco is available
here.
| Commodity Prices | Latest Week | Y/Y | October | September | Oct. '07 | 2007 | 2006 | 2005 |
|---|---|---|---|---|---|---|---|---|
| Industrial Metals | ||||||||
| Aluminum ($/Metric Ton) | 0.89 | -22.2% | 0.99 | 1.16 | 1.10 | 1.18 | 1.18 | 0.89 |
| Stainless Steel Scrap ($/Ton) | 2,121 | -11.3% | 2,121 | 2,538 | 2,221 | 2,786 | 2,918 | 1,268 |
| High Grade Copper ($/lb) | 1.64 | -47.1% | 2.20 | 3.12 | 3.58 | 3.06 | 3.04 | 2.28 |
| Foods | ||||||||
| Milk (Cents/lb.) | 94 | -49.2% | 100 | 123 | 193 | 172 | 145 | 98 |
| Beef Carcass (Index Value) | 143.3 | 5.3% | 137.2 | 147.4 | 137.7 | 139.3 | 134.1 | 150.3 |
| Corn, No. 2 Yellow ($/bushel) | 3.41 | -5.1% | 3.66 | 4.92 | 3.27 | 4.14 | 3.46 | 2.00 |
| Wheat, Soft Red ($/bushel) | 4.01 | -45.7% | 3.87 | 5.11 | 8.06 | 8.64 | 4.77 | 3.34 |
| Light Sweet Crude Oil, WTI ($/bbl.) | 64.31 | -32.5% | 78.40 | 104.66 | 85.00 | 72.25 | 66.12 | 56.60 |
| Gold, Handy & Harmon ($/oz.) | 733.75 | -8.8% | 802.9 | 828.7 | 753.10 | 810.5 | 628.7 | 507.4 |
by Robert Brusca November 12, 2008
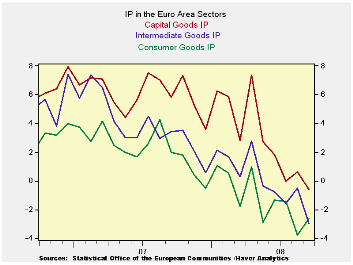
Euro Area industrial output (IP) fell sharply in October
dropping by its largest amount in over five years. In Sept MFG IP is
dropping across all major product groupings just as it did in August
and nearly did so in July. In the EMU the drop in IP has become
intense, widespread and persistent. Across the largest EU/EMU countries
IP also fell in Sept with the exception of Spain where numbers are more
volatile than resilient. Spain in fact has the deepest decline in IP
for Q3 at a -14% annual rate. Indeed, Germany, France, Italy and the UK
all have drops in IP in Q3 as well. It is pretty clear that with
declines of this magnitude (apart from Spain’s larger drop) ranging
from -2.7% to -5% these economies are in recession or heading there
soon.
In Germany the wise men issued a statement urging more public
spending to boost the economy and urged the ECB to cut rates as much as
it could see its way to do. They predict a recession in German for
2009, based on a wide variety of metrics. .
Similarly the Bank of England in a statement issued on the day
said that the UK economy has probably entered recession in the second
half of 2008. It does not see GDP growing until the second half of
2009. It sees inflation falling relatively rapidly.
Assessments of the economy in Europe are being cut rapidly.
Evidence on the economy is that growth is fading fast. In this
environment oil prices are sliding on the weakness in global demand
even with some OPEC output cuts having been announced and with China
having unveiled a better-than one-half of one trillion dollar stimulus
plan. China further announced that as part of that plan it would
implement export tax rebates and cut taxes on some export items. In
July the government had implemented some export tax breaks for the
garment industry. While China portrays some of these as factors to
‘stimulate domestic demand’ it seems that these really are efforts to
keep getting a chunk of foreign demand at a time that the size of that
pie is shrinking or at least growing more slowly. China’s ‘stimulus’
may not be as helpful to the rest of the world as it thinks.
| Euro Area MFG IP | ||||||||||
|---|---|---|---|---|---|---|---|---|---|---|
| Saar except m/m | Mo/Mo | 3-Mo | 6-mo | 12-mo | ||||||
| Euro Area Detail | Sep 08 |
Aug 08 |
Ju 08 |
Sep 08 |
Aug 08 |
Sep 08 |
Aug 08 |
Sep 08 |
Aug 08 |
Q-3 |
| MFG | -1.7% | 0.8% | -0.2% | -4.5% | 1.9% | -4.5% | -2.5% | -2.3% | -1.1% | -3.4% |
| Consumer Goods | -0.4% | -0.5% | 0.0% | -3.5% | 0.5% | -2.7% | -3.9% | -2.6% | -3.7% | -2.9% |
| Consumer Durables Goods | -2.5% | 1.2% | -1.0% | -8.9% | 3.1% | -6.2% | -5.2% | -6.2% | -6.7% | -- |
| Consumer Nondurables Goods | -0.4% | -0.3% | -0.1% | -3.5% | 0.9% | -2.8% | -3.2% | -2.3% | -3.0% | -- |
| Intermediate Goods | -2.6% | 1.4% | -0.3% | -5.9% | 3.7% | -5.3% | -1.6% | -3.0% | -0.5% | -3.6% |
| Capital Goods | -1.8% | 1.4% | -0.4% | -2.8% | 3.1% | -2.1% | -2.1% | -0.6% | 0.6% | -3.8% |
| Main Euro Area Countries and UK IP in MFG | ||||||||||
| Mo/Mo | 3-Mo | 6-mo | 12-mo | |||||||
| MFG Only | Sep 08 |
Aug 08 |
Jul 08 |
Sep 08 |
Aug 08 |
Sep 08 |
Aug 08 |
Sep 08 |
Aug 08 |
Q-2 Date |
| Germany: | -3.8% | 3.3% | -1.8% | -9.4% | 8.4% | -7.1% | 0.2% | -2.0% | 2.0% | -4.8% |
| France: IP excl Construction | -0.5% | -0.4% | 1.3% | 1.6% | 0.4% | -4.2% | -5.4% | -1.9% | -2.6% | -2.7% |
| Italy | -2.3% | 0.4% | -1.3% | -12.1% | -2.1% | -8.0% | -4.1% | -5.7% | -4.3% | -8.4% |
| Spain | 3.1% | -10.1% | 12.1% | 16.7% | -16.2% | 14.8% | -25.4% | -4.4% | -11.2% | -14.0% |
| UK | -0.8% | -0.6% | -0.2% | -6.0% | -4.9% | -5.1% | -4.7% | -2.2% | -2.0% | -5.0% |

Tom Moeller
AuthorMore in Author Profile »Prior to joining Haver Analytics in 2000, Mr. Moeller worked as the Economist at Chancellor Capital Management from 1985 to 1999. There, he developed comprehensive economic forecasts and interpreted economic data for equity and fixed income portfolio managers. Also at Chancellor, Mr. Moeller worked as an equity analyst and was responsible for researching and rating companies in the economically sensitive automobile and housing industries for investment in Chancellor’s equity portfolio. Prior to joining Chancellor, Mr. Moeller was an Economist at Citibank from 1979 to 1984. He also analyzed pricing behavior in the metals industry for the Council on Wage and Price Stability in Washington, D.C. In 1999, Mr. Moeller received the award for most accurate forecast from the Forecasters' Club of New York. From 1990 to 1992 he was President of the New York Association for Business Economists. Mr. Moeller earned an M.B.A. in Finance from Fordham University, where he graduated in 1987. He holds a Bachelor of Arts in Economics from George Washington University.
More Economy in Brief


