 Global| May 20 2011
Commodity Prices Are Down, But Not Out
by:Tom Moeller
|in:Economy in Brief
Summary
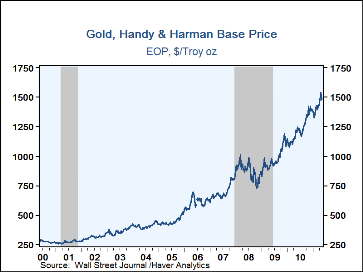
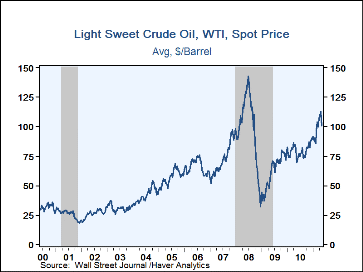
Earlier strength in commodity prices recently has given way to modest decline. Gold prices fell yesterday to $1,493 per ounce versus the high two weeks ago of $1,540. Crude oil prices were near the recent low at $98.44 per barrel [...]
Earlier strength in commodity prices recently has given way to modest decline. Gold prices fell yesterday to $1,493 per ounce versus the high two weeks ago of $1,540. Crude oil prices were near the recent low at $98.44 per barrel versus the late-April high of $113.93. In fact, most commodity prices have shown similar weakness. For its part, the economic news from the U.S. has been disappointing -- from home sales to real consumer spending and from industrial output to small business sentiment. There hardly is enough weakness in the data to get too concerned about economic growth. Growth should remain positive. But forecast numbers recently have been revised lower.
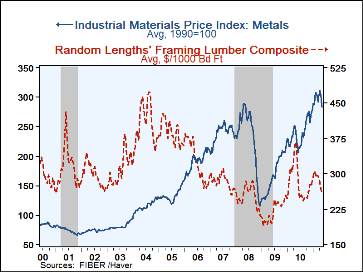
Industrial commodity prices have exhibited most of the recent weakness. The FIBER price index is down 10.0% from its April high led by declines of at least that amount in zinc, aluminum and copper scrap prices. However, it's hard to get too bearish given that these, and other industrial materials prices are still up sharply from their respective lows. Textile product prices recently showed a lesser 5.0% price decline led by lower cotton prices, but a modest rebound already has taken hold. The housing sector is where weakness continues to drive commodity prices down. Framing lumber costs have yet to find support after their recent 15.1% decline from the January high.
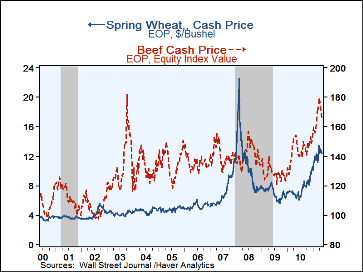
Prices for many agricultural products have shown volatility similar to industrials. Wheat & corn prices at least have stabilized after earlier declines. However, meat prices have yet to put a floor under a decline which began in April.
The recent weakening of commodity prices comes in tandem with the softness of industrial output. In April it fell 0.4% for the first monthly decline since the last recession's end. Most of that decline was due to lower motor vehicle output resulting from the earthquake in Japan, but less motor vehicles output softened as well. Going forward economic growth should continue, at least that's the conclusion reached by most forecasters based on low interest rates and the release of pent-up demand. A sign that growth is firming is a necessary ingredient to firmer commodity prices.
Commodity price data can be found in Haver's DAILY, WEEKLY and CMDTY databases.
Commodity Prices and Inflation is analysis from the Federal Reserve Bank of San Francisco in 1996. It can be found here.
| Commodity Prices | Latest | Latest Y/Y | 2010 | 2009 | 2008 |
|---|---|---|---|---|---|
| Gold ($ per troy ounce.) | 1,493 | 25.3% | 1,224.3 | 972.3 | 872.0 |
| Crude Oil ($ per barrel) | 98.44 | 44.7 | 79.42 | 61.83 | 99.83 |
| Commodity Research Bureau Spot Index - All Commodities (1967=100) | 560 | 31.2 | 451 | 361 | 422 |
| Foodstuffs | 501.6 | 40.0 | 379 | 310 | 373 |
| Livestock & Products | 622.6 | 30.1 | 470 | 355 | 457 |
| FIBER Industrial Materials Price Indexes (1990=100) | 176.3 | 9.6 | 158 | 122 | 148 |
| Textiles | 90 | 12.9 | 81 | 73 | 74 |
| Cotton (cents per pound) | 159 | 108.8 | 88.0 | 52.6 | 58.1 |
| Metals | 283 | 29.8 | 240 | 169 | 231 |
| Aluminum ($ per metric ton) | 2,510 | 27.5 | 2,173 | 1,665 | 2,572 |
| Copper Scrap (cents per pound) | 404 | 39.6 | 327 | 197 | 281 |
| Steel Scrap ($ per ton) | 410 | 10.6 | 327 | 204 | 350 |
| Miscellaneous | 189 | -12.1 | 179 | 128 | 159 |
| Natural Rubber (cents per pound) | 269 | 35.1 | 183 | 84 | 124 |
| Framing Lumber ($ per 1000 board) | 259 | -24.7 | 293 | 221 | 253 |
Tom Moeller
AuthorMore in Author Profile »Prior to joining Haver Analytics in 2000, Mr. Moeller worked as the Economist at Chancellor Capital Management from 1985 to 1999. There, he developed comprehensive economic forecasts and interpreted economic data for equity and fixed income portfolio managers. Also at Chancellor, Mr. Moeller worked as an equity analyst and was responsible for researching and rating companies in the economically sensitive automobile and housing industries for investment in Chancellor’s equity portfolio. Prior to joining Chancellor, Mr. Moeller was an Economist at Citibank from 1979 to 1984. He also analyzed pricing behavior in the metals industry for the Council on Wage and Price Stability in Washington, D.C. In 1999, Mr. Moeller received the award for most accurate forecast from the Forecasters' Club of New York. From 1990 to 1992 he was President of the New York Association for Business Economists. Mr. Moeller earned an M.B.A. in Finance from Fordham University, where he graduated in 1987. He holds a Bachelor of Arts in Economics from George Washington University.
More Economy in Brief
 Global| Feb 05 2026
Charts of the Week: Balanced Policy, Resilient Data and AI Narratives
by:Andrew Cates


