 Global| Jun 02 2005
China Trade in Surplus, but Imports Are Large, Nonetheless
Summary
In the May edition of "Haver Analytics News", we announced the availability of the CEIC China Premium Database. This new database, CHINA, has over 125,000 series covering many, many facets of Chinese economic life. The level of detail [...]
In the May edition of "Haver Analytics News", we announced the availability of the CEIC China Premium Database. This new database, CHINA, has over 125,000 series covering many, many facets of Chinese economic life. The level of detail is extensive, including such items as the number of visitors to China who arrive on foot in any given month, the prices for common Portland cement by intensity and the gross domestic product of Shanghai, annually, by industry.
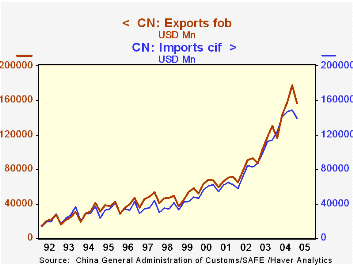
Earlier this week, the General Administration of Customs reported foreign trade data for April. The surplus was $4.6 million, consisting of $62.2 billion in exports and $57.6 billion in imports. On examining these figures over time, we were startled to find that, while trade surpluses prevail, the trend is not nearly the one-sided imbalance that one might envision. In fact, there has even been the occasional monthly trade deficit. During the last 12 months, the surplus has averaged $5.4 billion, equivalent to just about 10% of China's exports. By contrast, in Japan, the 12-month average trade surplus has represented 23% of exports and in Germany, 21%, much larger proportional imbalances than in China.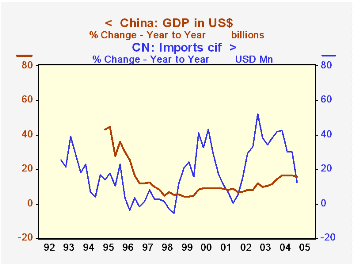
Thus, not only are China's exports large and growing rapidly, so are China's imports. In 2004, exports of goods totaled $593.6 billion, up 35.4% from 2003. Imports were $560.8 billion, up 35.8%. Just in the last three months, however, imports have slowed, so their average for February, March and April is "just" 10.8% higher than a year ago. Products contributing most to the lessening pace include textiles, paper and several machinery categories. At the same time, as elsewhere, petroleum imports continue to grow strongly, along with its derivatives, chemicals and plastics. Some durable goods remain strong as well, including wood products and electrical equipment.
In the second graph here, we show imports growth along with that of GDP. We see that most of the time since 1999 imports have grown faster than GDP. Thus, even as trade accounts run surpluses, China clearly spends a sizable portion of its export earnings on imported products. A concentration in machinery suggests that building and upgrading plants is a major priority.
| China Millions of US$ |
12-Mo Avg, Apr 2005 | Apr 2005 | Mar 2005 | Apr 2004 | Monthly Averages|||
|---|---|---|---|---|---|---|---|
| 2004 | 2003 | 2002 | |||||
| Trade Balance | 5392 | 4591 | 5733 | -2250 | 2736 | 2115 | 2528 |
| Exports, fob | 54071 | 62151 | 60869 | 47124 | 49471 | 36540 | 27137 |
| Imports, cif | 48680 | 57560 | 55136 | 49374 | 46734 | 34425 | 24609 |
Carol Stone, CBE
AuthorMore in Author Profile »Carol Stone, CBE came to Haver Analytics in 2003 following more than 35 years as a financial market economist at major Wall Street financial institutions, most especially Merrill Lynch and Nomura Securities. She had broad experience in analysis and forecasting of flow-of-funds accounts, the federal budget and Federal Reserve operations. At Nomura Securities, among other duties, she developed various indicator forecasting tools and edited a daily global publication produced in London and New York for readers in Tokyo. At Haver Analytics, Carol was a member of the Research Department, aiding database managers with research and documentation efforts, as well as posting commentary on select economic reports. In addition, she conducted Ways-of-the-World, a blog on economic issues for an Episcopal-Church-affiliated website, The Geranium Farm. During her career, Carol served as an officer of the Money Marketeers and the Downtown Economists Club. She had a PhD from NYU's Stern School of Business. She lived in Brooklyn, New York, and had a weekend home on Long Island.
More Economy in Brief


