 Global| Jul 31 2006
Chicago Surveys of Factory Activity Mixed
by:Tom Moeller
|in:Economy in Brief
Summary
The Chicago Federal Reserve Bank's Midwest manufacturing index jumped 0.8% during June following a revised 0.1% dip in May. Improvement in the auto sector dominated the June rise. The three month growth rate remained firm at 5.8% [...]
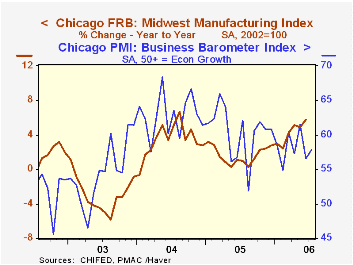
The Chicago Federal Reserve Bank's Midwest manufacturing index jumped 0.8% during June following a revised 0.1% dip in May. Improvement in the auto sector dominated the June rise. The three month growth rate remained firm at 5.8% though growth in the index peaked late last year at 9.4%.
During the last ten years there has been a 95% correlation between the y/y change in Chicago's Midwest Mfg. index and the change in US factory sector industrial production. The June Chicago Fed Midwest Manufacturing Index can be found here.
During July, the Chicago Purchasing Managers Association reported that its Business Barometer improved moderately to 57.9 from 56.5 in June. These readings are down from an average 60.4 last year and reflect weaker figures for orders and employment.
During the last ten years there has been a 65% correlation between the level of the Chicago PMI Business Barometer and y/y change in US factory sector industrial production. The July report from the Chicago Purchasing Managers Association can be found here.
| Federal Reserve Surveys | June | May | June '05 | 2005 | 2004 | 2003 |
|---|---|---|---|---|---|---|
| Chicago Fed Midwest Mfg. Index (2002 = 100) | 107.0 | 106.2 | 101.2 | 102.1 | 100.4 | 97.1 |
by Tom Moeller July 31, 2006
An acceleration in the "core" PCE chain price index within the 2Q GDP report rankled markets on Friday. At 2.9%, the q/q increase was a marked acceleration from the 2.0% average of the prior four quarters
Indeed, the price index for durable personal consumption indicated deflation at a slower rate and the y/y gain in service prices accelerated to 3.6% from a low of 3.1% late last year. That acceleration reflected a 5.0% surge during 4Q05.
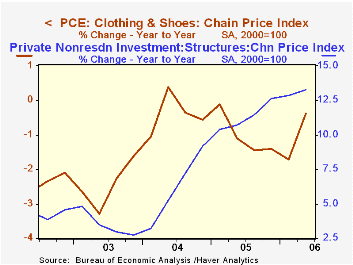
The price index for clothing & shoes was, however, the main bugger as it posted a 3.5% gain (AR) last quarter after several years of price deflation.
Several price indexes showed slower rates of growth including most business investment categories, residential investment and federal government.
Also moving moderately to the upside were the gains in the price indexes for state & local government as well as exports. Continuing strong were the gains in the nonresidential investment chain price index for structures, up 10.7% (AR) last quarter and 13.3% y/y after an 11.3% surge last year.
| Chain Price Indexes | 2Q '06 | 1Q '06 | Y/Y | 2005 | 2004 | 2003 |
|---|---|---|---|---|---|---|
| GDP | 3.3% | 3.3% | 3.3% | 3.0% | 2.8% | 2.1% |
| Personal Consumption | 4.1% | 2.0% | 3.3% | 2.9% | 2.6% | 2.0% |
| Less Food & Energy | 2.9% | 2.1% | 2.3% | 2.1% | 2.0% | 1.4% |
| Durables | -0.8% | -1.0% | -1.5% | -0.7% | -1.6% | -3.6% |
| Nondurables | 3.3% | 3.3% | 3.3% | 3.0% | 2.8% | 2.1% |
| Clothing & Shoes | 3.5% | -1.0% | -0.4% | -1.0% | -0.4% | -2.5% |
| Services | 3.1% | 3.1% | 3.6% | 3.2% | 3.2% | 3.2% |
| Investment: Equipment & Software | 0.0% | 0.6% | -0.5% | -0.4% | -0.4% | -1.1% |
| Investment: Residential | 2.0% | 3.8% | 4.8% | 5.1% | 7.3% | 4.8% |
by Louise Curley July 31, 2006
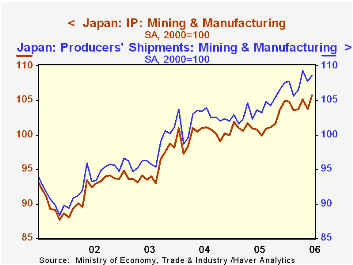
As Carol Stone noted last Friday, economic conditions remain positive in Japan in spite of some easing in the labor market in June. METI (The Ministry of Economics, Trade and Industry) released preliminary data today on industrial production, shipments and inventories--all showing increases in June. Industrial production increased 1.9%. shipments, 0.7% and inventories, 0.5%.
The largest contributors to the rise in industrial production were: Transport Equipment, General Machinery and Electrical Machinery. The largest contributors to the rise in Shipments were: General Machinery, Iron and Steel and Electronic Parts and Devices. Shipments of Transport Equipment, in contrast to production declined 1.06%. Total Industrial production and shipments are shown in the first chart.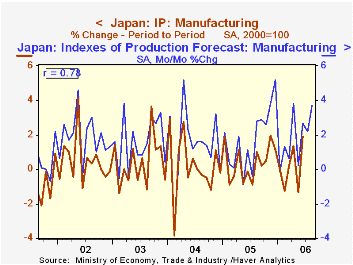
Even more encouraging than the data for June are the forecasts of the changes in industrial production for the current month and the month following. Currently the forecasts are for a 2.2% increase in July and a 3.7% increase for August. As the second chart illustrates, the forecasts rarely seem to see any declines in the months ahead and generally overstate any increases. Nevertheless, they do well in forecasting direction. The correlation between the two series .78..
| Japan | Jun 06 | May 06 | Jun 05 | M/M | Y/Y | 2005 | 2004 | 2003 |
|---|---|---|---|---|---|---|---|---|
| Industrial Production (2000=100) | 105.7 | 103.7 | 100.8 | 1.93 | 4.86 | 101.6 | 100.0 | 95.1 |
| Transport Equipment | 126.5 | 119.4 | 1230.3 | 5.95 | 5.15 | 121.0 | 114.8 | 107.2 |
| Shipments (2000=100) | 108.6 | 107.8 | 103.6 | 0.74 | 4.83 | 104.1 | 102.3 | 97.3 |
| Transport Equipment | 121.9 | 123.23 | 118.0 | -1.06 | 3.31 | 117.3 | 113.5 | 108.4 |
| Inventories (2000=100) | 93.9 | 93.4 | 92.3 | 0.54 | 1.73 | 92.8 | 90.0 | 91.1 |

Tom Moeller
AuthorMore in Author Profile »Prior to joining Haver Analytics in 2000, Mr. Moeller worked as the Economist at Chancellor Capital Management from 1985 to 1999. There, he developed comprehensive economic forecasts and interpreted economic data for equity and fixed income portfolio managers. Also at Chancellor, Mr. Moeller worked as an equity analyst and was responsible for researching and rating companies in the economically sensitive automobile and housing industries for investment in Chancellor’s equity portfolio. Prior to joining Chancellor, Mr. Moeller was an Economist at Citibank from 1979 to 1984. He also analyzed pricing behavior in the metals industry for the Council on Wage and Price Stability in Washington, D.C. In 1999, Mr. Moeller received the award for most accurate forecast from the Forecasters' Club of New York. From 1990 to 1992 he was President of the New York Association for Business Economists. Mr. Moeller earned an M.B.A. in Finance from Fordham University, where he graduated in 1987. He holds a Bachelor of Arts in Economics from George Washington University.
More Economy in Brief


