 Global| Apr 30 2018
Chicago PMI Stays on Lower Plane
Summary
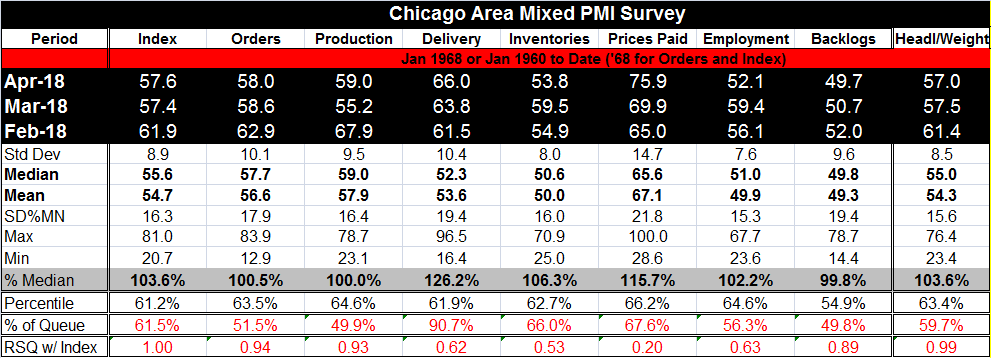
The Chicago mixed manufacturing and services local index ticked slightly higher in April but kept most of the step down in place from last month. Over the last two months, the index is essentially back to where it had been between [...]
 The Chicago mixed manufacturing and services local index ticked slightly higher in April but kept most of the step down in place from last month. Over the last two months, the index is essentially back to where it had been between March and April of last year.
Metrics by which to understand the Chicago PMI
The ‘% of Queue’ standings place each current reading in an ordered queue of historic readings expressed as a percentile standing in that queue. For example, the barometer at 57.6 in April has a 61.5 queue percentile standing. That tells us that it has been higher only about 38.5% of the time. For each category, its median diffusion reading is at the value of 50. This month we have below median readings for production and for backlogs with orders just a small margin above their historic median. These are calculated on data back to February 1967.
In the last two months, the Chicago index has moved back to a position of moderation. The queue standings are now mostly in the 60th decile range or lower. At that mark, Chicago is indicating above median growth but growth that is in some sense 30% to 40% below its best showing. Most of the queue standings are in their lower 60th percentile, implying that the various indexes are somewhat above their respective medians
Formally the percentile standings do not indicate magnitudes (the underlying diffusion indexes do not represent magnitude either they gauge the breadth of increases across a pool of respondents). The percentile standings indicate the percentage of the time that an index is stronger or weaker than the current observation. However, in the table, we also present evidence on how the current observations stack up as ratio to their respective medians. For PMI components with rankings in the 60th decile of their respective histories, the ratio to their median ranges from a high of 115% to a low of 104%. The relationship between the ratio and queue ranking is determined by the density of the distribution of historic observations. Each component has a different tendency. For example, employment has the smallest range. It has a range of values in a 44.1 point range from 67.7 to 23.6. Compare that to deliveries that have an 80.1 point range spanning 96.5 to 16.4. The percentile standings permit comparisons between these components than have very different characteristics. Clearly you cannot compare diffusion values directly across components and discern any meaning from that.
Delivery speeds are the relative strongest reading this month, telling us that the ability to supply goods and services quickly is under pressure and delivery lags are stretching out. But production has a below median ranking as do backlogs, indicating stress on the system is being alleviated by a softening in activity and by less business in the pipeline. The employment gauge fell on the month and has now a 56.3 percentile standing; orders are similarly weaker but above their median.
The usage of the queue percentiles permits us to have a more precise understanding of what is going on in the PMI report. Without calculating these standings, all we know is that a raw diffusion score above 50 means expansion and below 50 implies contraction. While we still cannot make absolute statements about what kind of strength a production reading of 59 has, we can compare its performance to its fellow components or on a relative scale to its own history to gain context.
Among the interesting features this month in the Chicago index are the sharp drop in the employment reading and the sharp jump in the prices paid index. However, note the calculated standard deviations in the table. The prices paid index rises by 6 points while employment fell by 7.3 points. That is a much more significant change for employment since its standard deviation is only 7.6, a little more than half the standard deviation of prices-paid. Alternatively we can note that the rise in prices-paid is a rise representing 8.4% of its range while for employment its fall is drop representing 16.6% of its range.
The Chicago PMI is a mixed index of various sorts of businesses; it is not a services or manufacturing only index. For that reason, its numeric barometer readings tend to be higher than for pure manufacturing indexes. The percentile standing calculations help to sort that out.
What we see in April is that the Chicago area has been little changed, but it stepped back in March and has remained restrained in April. Delivery lags still have a legacy effect of being ‘tight.’ But since production, orders and backlogs have receded to near median values, the pressure on supply times should abate. Employment conditions were pulled back quite smartly in the month. But curiously prices-paid, which tend to be a leading statistic, have moved up strongly. That is the one element in this report that does not fit with the other readings and it will bear watching.

Robert Brusca
AuthorMore in Author Profile »Robert A. Brusca is Chief Economist of Fact and Opinion Economics, a consulting firm he founded in Manhattan. He has been an economist on Wall Street for over 25 years. He has visited central banking and large institutional clients in over 30 countries in his career as an economist. Mr. Brusca was a Divisional Research Chief at the Federal Reserve Bank of NY (Chief of the International Financial markets Division), a Fed Watcher at Irving Trust and Chief Economist at Nikko Securities International. He is widely quoted and appears in various media. Mr. Brusca holds an MA and Ph.D. in economics from Michigan State University and a BA in Economics from the University of Michigan. His research pursues his strong interests in non aligned policy economics as well as international economics. FAO Economics’ research targets investors to assist them in making better investment decisions in stocks, bonds and in a variety of international assets. The company does not manage money and has no conflicts in giving economic advice.


