 Global| Aug 22 2016
Chicago Fed National Activity Index Firms
by:Tom Moeller
|in:Economy in Brief
Summary
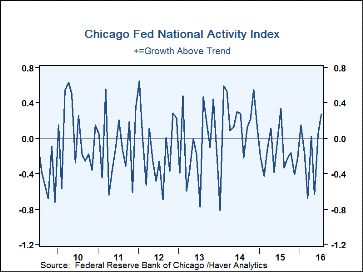
The National Activity Index from the Federal Reserve Bank of Chicago increased to 0.27 during July from 0.05 in June, revised from 0.16. It was the strongest reading in twelve months. The three-month moving average improved to -0.10, [...]
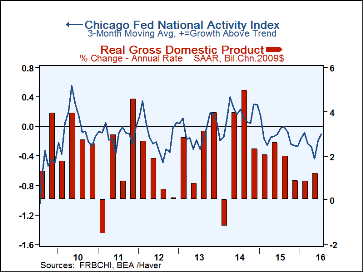
The National Activity Index from the Federal Reserve Bank of Chicago increased to 0.27 during July from 0.05 in June, revised from 0.16. It was the strongest reading in twelve months. The three-month moving average improved to -0.10, its best reading since February. During the last ten years, there has been a 75% correlation between the Chicago Fed Index and the q/q change in real GDP.
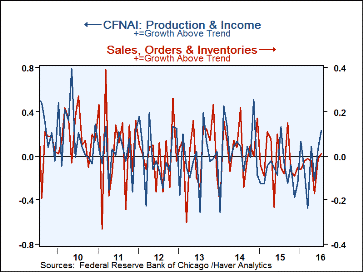
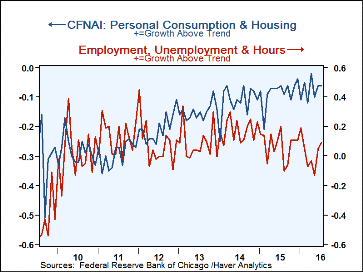
Improvement in the component series was widespread. The Production & Income reading rose sharply to 0.23, its highest point since last July. The Employment, Unemployment & Hours figure increased to 0.09, the strongest reading in six months. The Sales, Orders & Inventories figure was positive for the first time since September. Holding steady was the Personal Consumption & Housing reading. The Fed reported that 53 of the 85 component series made positive contributions to the total while 32 made negative contributions.
The CFNAI is a weighted average of 85 indicators of national economic activity. It is constructed to have an average value of zero and a standard deviation of one. Since economic activity tends toward trend growth rate over time, a positive index reading corresponds to growth above trend and a negative index reading corresponds to growth below trend.
The Chicago Federal Reserve figures are available in Haver's SURVEYS database.
Remarks on the U.S. Economy from Stanley Fischer, Vice Chairman of the Federal Reserve can be found here.
| Chicago Federal Reserve Bank | Jul | Jun | May | Jul '15 | 2015 | 2014 | 2013 |
|---|---|---|---|---|---|---|---|
| National Activity Index (percent) | 0.27 | 0.05 | -0.63 | 0.34 | -0.17 | 0.16 | -0.08 |
| 3-Month Moving Average | -0.10 | -0.19 | -0.43 | -0.02 | -- | -- | -- |
| Personal Consumption & Housing | -0.06 | -0.06 | -0.10 | -0.06 | -0.09 | -0.11 | -0.15 |
| Employment, Unemployment & Hours | 0.09 | 0.05 | -0.13 | 0.20 | 0.07 | 0.18 | 0.09 |
| Production & Income | 0.23 | 0.07 | -0.22 | 0.26 | -0.14 | 0.06 | -0.04 |
| Sales, Orders & Inventories | 0.01 | -0.01 | -0.17 | -0.05 | -0.02 | 0.04 | 0.02 |
Tom Moeller
AuthorMore in Author Profile »Prior to joining Haver Analytics in 2000, Mr. Moeller worked as the Economist at Chancellor Capital Management from 1985 to 1999. There, he developed comprehensive economic forecasts and interpreted economic data for equity and fixed income portfolio managers. Also at Chancellor, Mr. Moeller worked as an equity analyst and was responsible for researching and rating companies in the economically sensitive automobile and housing industries for investment in Chancellor’s equity portfolio. Prior to joining Chancellor, Mr. Moeller was an Economist at Citibank from 1979 to 1984. He also analyzed pricing behavior in the metals industry for the Council on Wage and Price Stability in Washington, D.C. In 1999, Mr. Moeller received the award for most accurate forecast from the Forecasters' Club of New York. From 1990 to 1992 he was President of the New York Association for Business Economists. Mr. Moeller earned an M.B.A. in Finance from Fordham University, where he graduated in 1987. He holds a Bachelor of Arts in Economics from George Washington University.


