 Global| Aug 25 2008
Chicago Fed Index Slightly Weaker in July
by:Tom Moeller
|in:Economy in Brief
Summary
For July, the Chicago Federal Reserve Bank indicated that its National Activity Index (CFNAI) weakened slightly. The reading of -0.67 was lower than the revised figure of -0.59 in June. The three-month moving average of the index, [...]
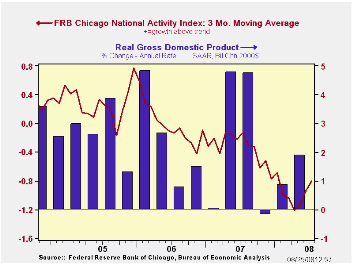
For July, the Chicago Federal Reserve Bank indicated that its National Activity Index (CFNAI) weakened slightly. The reading of -0.67 was lower than the revised figure of -0.59 in June.
The three-month moving average of the index, however, improved somewhat to -0.80 from -0.94 during the prior month. The figures were the least negative since January.
An index level at or below -0.70 typically has indicated negative U.S. economic growth. A zero value of the CFNAI indicates that the economy is expanding at its historical trend rate of growth of roughly 3%. During the last twenty years there has been a 68% correlation between the level of the CFNAI and q/q growth in real GDP.
The complete CFNAI report is available here and the historical data are available in Haver's SURVEYS database.
The components of the July index were mostly unchanged from
June.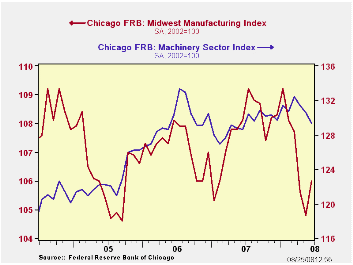
The CFNAI is a weighted average of 85 indicators of economic activity. The indicators reflect activity in the following categories: production & income, the labor market, personal consumption & housing, manufacturing & trade sales, and inventories & orders.
In a separate survey, the Chicago Fed indicated that its Midwest manufacturing index improved in June to its best level since March. A rise in the auto sector sub-component was offset by deterioration the steel, machinery and resource sector indexes.
Reducing Systemic Risk is Friday's speech by Fed ChairmanBen S. Bernanke at the Federal Reserve Bank of Kansas City's Annual Economic Symposium, Jackson Hole, Wyoming and it can be found here.
Creating value-based competition in heath care from the Federal Reserve Bank of Chicago is available here.
| Chicago Fed | July | June | July '07 | 2007 | 2006 | 2005 |
|---|---|---|---|---|---|---|
| CFNAI | -0.67 | -0.59 | 0.09 | -0.43 | -0.04 | 0.27 |
| 3-Month Average | -0.80 | -0.94 | -0.13 |
by Tom Moeller August 25, 2008
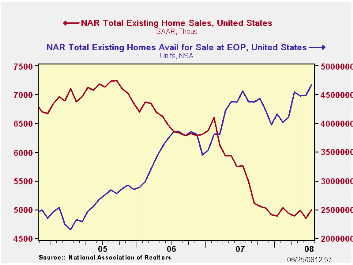
The level of existing homes rose 3.1% last month to 5.00 million. The figure, reported by the National Association of Realtors, more than made up a 2.8% decline during June and the rise lifted sales to the highest level since February. The figure was firmer than Consensus expectations for a selling rate of 4.91M homes. Total sales include sales of condos and co-ops.
Sales of existing single-family homes also made up (most) of their June decline and rose 3.1%. These sales (which have a longer history than the total) were still near the lowest level since early-1998.
By region, home sales in the West rose a sharp 9.7% (+0.9% y/y). They were up by more than one-quarter from last October's low. Sales in the Northeast also were firm and rose 5.9%. In the Midwest, however, sales posted only a modest 0.9% increase and in the South sales ticked 0.5% lower. These sales remained near the lowest level since 2000.
Median home prices last month reversed
just some of their June rise with a 1.3% decline. Nevertheless, prices
were up 8.6% from the February low.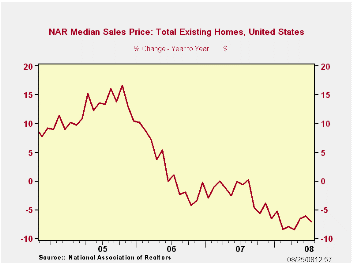
The number of unsold homes (condos & single-family) on the market rose 3.9% from June (2.4% y/y). At the current sales rate the inventory rose slightly to an 11.2 months supply which is the record high for this series. For single-family homes, however, the inventory was unchanged m/m (1.8% y/y) and that amounted to 10.6 months supply at the current sales rate. That was still near the highest supply since 1985.
Divorcing Money from Monetary Policy from the Federal Reserve Bank of New York can be found here.
Signal or Noise? Implications of the Term Premium for Recession Forecasting, also from the Federal Reserve Bank of New York, is available here.
| Existing Home Sales (Thous) | July | y/y % | June | July '07 | 2007 | 2006 | 2005 |
|---|---|---|---|---|---|---|---|
| Total | 5,000 | -13.2 | 4,850 | 5,760 | 5,672 | 6,508 | 7,076 |
| Northeast | 900 | -11.8 | 850 | 1,020 | 1,008 | 1,090 | 1,168 |
| Midwest | 1,120 | -17.0 | 1,110 | 1,350 | 1,331 | 1,491 | 1,589 |
| South | 1,850 | -18.1 | 1,860 | 2,260 | 2,240 | 2,576 | 2,704 |
| West | 1,130 | 0.9 | 1,030 | 1,120 | 1,093 | 1,353 | 1,617 |
| Single-Family | 4,390 | -12.4 | 4,260 | 5,010 | 4,958 | 5,703 | 6,181 |
| Median Price, Total, $ | 212,400 | -7.1 | 215,100 | 228,600 | 216,617 | 222,000 | 218,217 |
by Louise Curley August 25, 2008
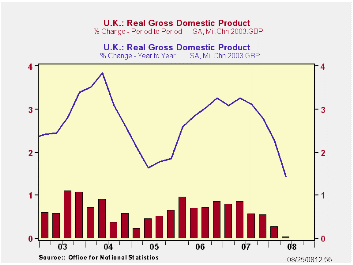
The Office of National Statistics (ONS) reported that real GDP
in the United Kingdom in the second quarter of this year was unchanged
from the first quarter. Consumption expenditures were little changed as
household consumption expenditures were down slightly by 0.06% and
government consumption expenditures up slightly by 0.4%. A substantial
improvement in the balance of trade in goods and services and a
increase in inventories were offset by an equally large decline in
gross fixed capital formation as a result of the declines in
investments in dwellings and in business and government capital
outlays. The first chart shows the quarter-to-quarter and the
year-to-year changes in GDP.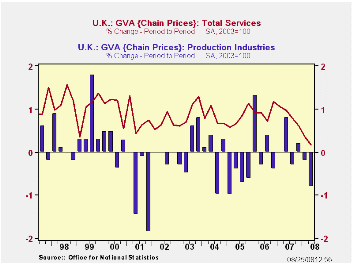
In terms of business activity, the production industries declined 0.8% in the second quarter, following a 0.2% decline in the first quarter. Construction was down 1.1%. The service industries managed a slight increase of 0.2%. The second chart shows the changes in the production and the services areas.
| UNITED KINGDOM | Q2 2008 | Q1 2008 | Q4 2007 | Q4 2007 | 2007 | 2006 | 2005 |
|---|---|---|---|---|---|---|---|
| Real GDP Q/Q Change | 0.0 | 0.3 | 0.6 | 0.5 | 3.06 | 2.92 | 1.84 |
| Y/Y Change | 1.4 | 2.3 | 2.8 | 3.1 | |||
| Real GVA Q/Q Change | 2.99 | 2.97 | 1.90 | ||||
| Production | -0.8 | -0.2 | 0.2 | -0.3 | |||
| Construction | -1.1 | 1.0 | 0.9 | 0.2 | |||
| Services | 0.2 | 0.3 | 0.6 | 0.5 | |||
by Robert Brusca August 25, 2008
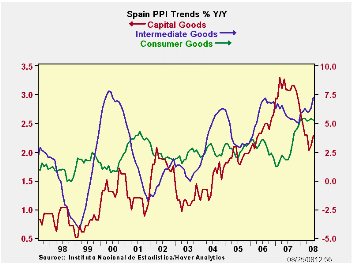
Not that SPAIN is an inflation bellwether but a 23-year high is a 23-year high -- Soaring energy costs sent Spanish producer price inflation to a 23 ½ year high of 10.1 percent in July. Many are calling this the peak in inflation. With energy prices as the culprit and world energy prices having moved off-peak, that bet seems a good one. Inflation in Spain, as in the rest of Europe, has been propelled by a 30 percent rise in energy prices. In July the headline rate was the greatest annual increase since November 1984 and it compared with a 9 percent rate of increase in June. Producer prices rose 1.3 percent month on month, compared to 1.4 percent in June. Since July lower consumer goods demand and a housing and credit crisis add to lower world oil prices as reasons for Spain’s inflation rate to abate.
Still e-Zoners have their lingering concerns. In Jackson Hole Wyoming as the KC Fed’s conference disbanded, Italy’s central back head Mario Draghi warned that if central banks became too preoccupied with financial stability they could lose their grip on inflation. Draghi argued that price stability was the true key to getting economies back on track. Clearly central bankers have a lot on their minds in addition to what is on their plates.
| Spain PPI | |||||||
|---|---|---|---|---|---|---|---|
| m/m | Saar | ||||||
| SPAIN | Jul-08 | Jun-08 | May-08 | 3-Mo | 6-Mo | Yr/Yr | Y/Y Yr Ago |
| Total | 1.3% | 1.4% | 1.2% | 16.3% | 11.1% | 10.1% | 2.3% |
| Consumer | 0.1% | 0.4% | 0.2% | 15.4% | 2.9% | 5.2% | 1.9% |
| Intermediate | 1.3% | 0.8% | 0.4% | 10.1% | 9.2% | 7.3% | 5.5% |
| Investment | 0.3% | 0.1% | 0.2% | 2.4% | 2.1% | 2.3% | 3.1% |
| HIPPXConstruction | #N/A | 1.4% | 1.1% | #N/A | #N/A | #N/A | 2.3% |

Tom Moeller
AuthorMore in Author Profile »Prior to joining Haver Analytics in 2000, Mr. Moeller worked as the Economist at Chancellor Capital Management from 1985 to 1999. There, he developed comprehensive economic forecasts and interpreted economic data for equity and fixed income portfolio managers. Also at Chancellor, Mr. Moeller worked as an equity analyst and was responsible for researching and rating companies in the economically sensitive automobile and housing industries for investment in Chancellor’s equity portfolio. Prior to joining Chancellor, Mr. Moeller was an Economist at Citibank from 1979 to 1984. He also analyzed pricing behavior in the metals industry for the Council on Wage and Price Stability in Washington, D.C. In 1999, Mr. Moeller received the award for most accurate forecast from the Forecasters' Club of New York. From 1990 to 1992 he was President of the New York Association for Business Economists. Mr. Moeller earned an M.B.A. in Finance from Fordham University, where he graduated in 1987. He holds a Bachelor of Arts in Economics from George Washington University.
More Economy in Brief


