 Global| Jun 29 2009
Chicago Fed Index Remains Stablein May At Highest Level Since October
by:Tom Moeller
|in:Economy in Brief
Summary
The National Activity Index published by the Chicago Federal Reserve Bank remained roughly unchanged during May versus April. Nevertheless, the index level of -2.30 was near its the highest level since October of last year. The latest [...]
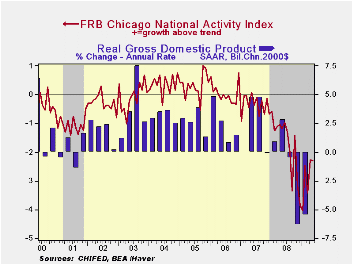 The National Activity Index published by the Chicago Federal
Reserve Bank remained roughly unchanged during May versus April.
Nevertheless, the index level of -2.30 was near its the highest level
since October of last year. The latest figure was up from the series'
low of -3.99 reached this past January. Since 1970 there has been a 75%
correlation between the level of the index and the q/q change in real
GDP.
The National Activity Index published by the Chicago Federal
Reserve Bank remained roughly unchanged during May versus April.
Nevertheless, the index level of -2.30 was near its the highest level
since October of last year. The latest figure was up from the series'
low of -3.99 reached this past January. Since 1970 there has been a 75%
correlation between the level of the index and the q/q change in real
GDP.
The three-month moving average of the index rose slightly versus April and stood at its highest level since November.
An index level at or below -0.70 typically has indicated negative U.S. economic growth. A zero value of the CFNAI indicates that the economy is expanding at its historical trend rate of growth of roughly 3%. The complete CFNAI report is available here and the historical figures are available in Haver's SURVEYS database.
The Bank reported that fifteen of the 85 individual indicators
made positive contributions to the index in May while 70 made a
negative contribution. The employment-related components made the
largest positive contributions to the May CFNAI. 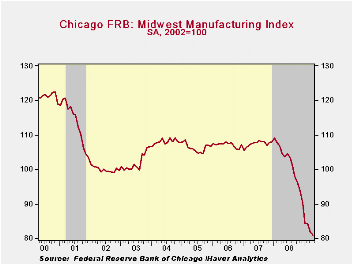
The CFNAI is a weighted average of 85 indicators of economic activity. The indicators reflect activity in the following categories: production & income, the labor market, personal consumption & housing, manufacturing & trade sales, and inventories & orders.
In a separate survey, the Chicago Fed indicated that its Midwest manufacturing index fell during April to its lowest level since 1994. Indicators for the steel, machinery and the auto sectors fell to new lows but in the resource sector the figure rose slightly.
Fuel efficiency challenges the auto industry from the Federal Reserve Bank of Chicago can be found here.
Residential Housing and Personal Bankruptcy from the Federal Reserve Bank of Philadelphia is available here.
| Chicago Fed | May | April | May '08 | 2008 | 2007 | 2006 |
|---|---|---|---|---|---|---|
| CFNAI | -2.30 | -2.27 | -1.18 | -1.77 | -0.36 | 0.03 |
| 3-Month Moving Average | -2.67 | -2.73 | -1.12 | -- | -- | -- |
by Louise Curley June 29, 2009
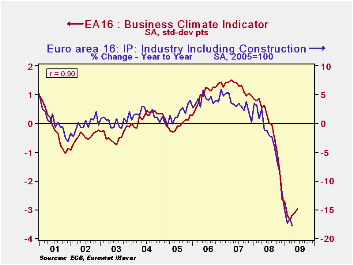
The European Commission's Business Climate Indicator for the
Euro Area is designed to deliver a clear and early assessment of the
cyclical situation. The extent that it has done so in the past can be
seen in the first chart that shows the Indicator and the year to year
change in industrial production. With a correlation between the two
series of 90%, 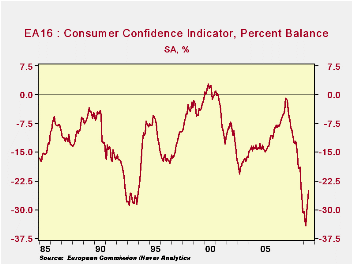 the R-Square is 81%, indicating that the business
climate indicator accounts for about 81% of the changes in the
industrial production. The rise in the indicator for the third
successive month in June is a good sign, but it is still at an
historically low level.
the R-Square is 81%, indicating that the business
climate indicator accounts for about 81% of the changes in the
industrial production. The rise in the indicator for the third
successive month in June is a good sign, but it is still at an
historically low level.
The individual results of the surveys of industry, the
construction, services, and retail trade businesses are reported as a
percent balances between those expecting improving and 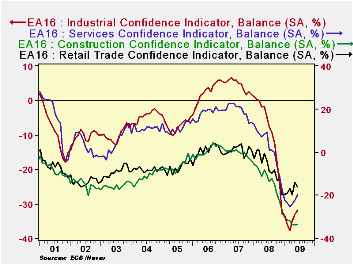 those expecting
deteriorating conditions in important aspects of business, such as
orders, production outlook, inventories, etc. Except for construction,
the other businesses have shown improvements over the last few months
as can be seen in the second chart.
those expecting
deteriorating conditions in important aspects of business, such as
orders, production outlook, inventories, etc. Except for construction,
the other businesses have shown improvements over the last few months
as can be seen in the second chart.
| European Commission: Confidence Measures | Jun 09 | May 09 | Apr 09 | Mar 09 |
|---|---|---|---|---|
| Business Climate Indicator (Pts of Std. Dev/) | -2.97 | -3.11 | -3.21 | -3.37 |
| Business Confidence (% Balance) | ||||
| Industry | -31.9 | -33.2 | -35.0 | -37.8 |
| Services | -19.8 | -22.5 | -24.2 | -25.4 |
| Construction | -33.5 | -33.7 | -33.6 | -31.8 |
| Retail Sales | -16.0 | -14.2 | -19.8 | -17.0 |
| Consumer Confidence (% Balance | -25.1 | -28.1 | -30.5 | -34.2 |

Tom Moeller
AuthorMore in Author Profile »Prior to joining Haver Analytics in 2000, Mr. Moeller worked as the Economist at Chancellor Capital Management from 1985 to 1999. There, he developed comprehensive economic forecasts and interpreted economic data for equity and fixed income portfolio managers. Also at Chancellor, Mr. Moeller worked as an equity analyst and was responsible for researching and rating companies in the economically sensitive automobile and housing industries for investment in Chancellor’s equity portfolio. Prior to joining Chancellor, Mr. Moeller was an Economist at Citibank from 1979 to 1984. He also analyzed pricing behavior in the metals industry for the Council on Wage and Price Stability in Washington, D.C. In 1999, Mr. Moeller received the award for most accurate forecast from the Forecasters' Club of New York. From 1990 to 1992 he was President of the New York Association for Business Economists. Mr. Moeller earned an M.B.A. in Finance from Fordham University, where he graduated in 1987. He holds a Bachelor of Arts in Economics from George Washington University.
More Economy in Brief


