 Global| Apr 29 2010
Chicago Fed Index Improves Modestly
by:Tom Moeller
|in:Economy in Brief
Summary
Weather constraints on U.S. economic growth abated last month, according to the Chicago Fed National Activity Index (CFNAI) from the Federal Reserve Bank of Chicago. Their index rose to -0.07 and recovered all of its February decline. [...]
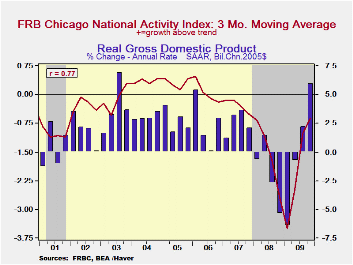
Weather constraints on U.S. economic growth abated last month, according to the Chicago Fed National Activity Index (CFNAI) from the Federal Reserve Bank of Chicago. Their index rose to -0.07 and recovered all of its February decline. The increase added to earlier gains from the series' low of -4.14 reached in January '09. During the last ten years the has been a 76% correlation between the index level and the q/q change in real GDP.
The three-month moving average of the index, which smoothes out some of the series' volatility, also improved to -0.18.
An index level at or below -0.70 typically has indicated negative U.S. economic growth. A zero value of the CFNAI indicates that the economy is expanding at its historical trend rate of growth of roughly 3.0%. The complete CFNAI report is available here.
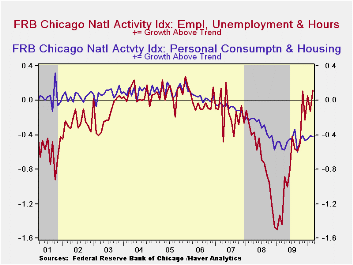
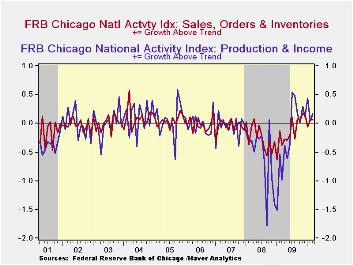
The Chicago Fed indicated that rebounds in the employment and in the production components contributed to the total index improvement. Overall, 50 of the 85 individual indicators made positive contributions to the index while 34 made negative contributions. The CFNAI is a weighted average of 85 indicators of economic activity. The indicators reflect activity in the following categories: production & income, the labor market, personal consumption & housing, manufacturing & trade sales, and inventories & orders.
In a separate survey, the Chicago Fed indicated that its Midwest manufacturing index improved during February to its highest level since December 2008. Indicators for the auto, steel, machinery and resource sectors each rose. The Chicago Federal Reserve figures are available in Haver's SURVEYS database.
| Chicago Fed | March | February | January | March '09 | 2009 | 2008 | 2007 |
|---|---|---|---|---|---|---|---|
| CFNAI | -0.07 | -0.44 | -0.05 | -3.37 | -1.62 | -1.79 | -0.35 |
| 3-Month Moving Average | -0.18 | -0.31 | -0.11 | -3.33 | -- | -- | -- |
| Personal Consumption & Housing | -0.42 | -0.41 | -0.45 | -0.56 | -0.49 | -0.32 | -0.09 |
| Employment, Unemployment & Hours | 0.12 | -0.13 | 0.05 | -1.45 | -0.76 | -0.67 | -0.15 |
| Production & Income | 0.18 | 0.04 | 0.44 | -0.99 | -0.24 | -0.56 | -0.05 |
| Sales, Inventories & Orders | 0.06 | 0.06 | -0.06 | -0.38 | -0.14 | -0.25 | -0.06 |
by Tom Moeller April 29, 2010
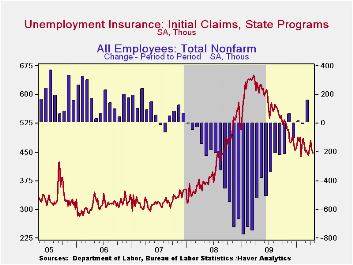
The job market is on the mend. The Bureau of Labor Statistics reported that initial claims for jobless insurance fell 11,000 to 448,000 after the prior week's revised 21,000 drop. The latest level equaled the March average and roughly matched Consensus expectations for a decline to 445,000 claims. Last week's figure was down from the recession peak of 651,000 reached in March of 2009. The four-week moving average of initial claims nudged up to 462,500.
A 18,000 decline in continuing claims for unemployment insurance during the latest week added to a revised 23,000 drop during the prior week. They were down by one-third from the June '09 peak. The overall decline is a function of the improved job market but also reflects the exhaustion of 26 weeks of unemployment benefits. Continuing claims provide an indication of workers' ability to find employment. The four-week average of continuing claims also fell to a cycle low of 4.639 mil. This series dates back to 1966.
Extended benefits for unemployment insurance increased to 202,215. However, they were down by three-quarters from a peak of 597,688 reached in November.
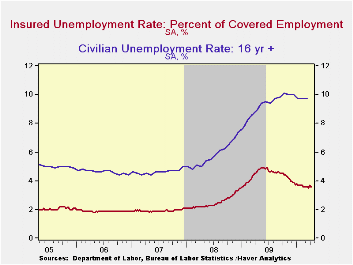
The insured unemployment rate held steady at 3.6%. The rate reached a high of 4.9% during May. During the last ten years, there has been a 96% correlation between the level of the insured unemployment rate and the overall rate of unemployment published by the Bureau of Labor Statistics.
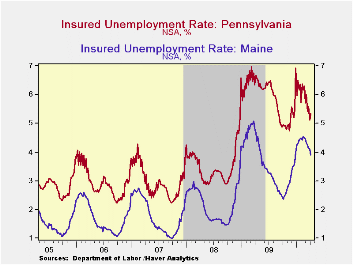
The highest insured unemployment rates in the week ending April 10 were in Alaska (6.6 percent), Puerto Rico (6.4), Oregon (5.9), Wisconsin (5.6), Pennsylvania (5.4), Nevada (5.2), California (5.0), Idaho (5.0), Montana (5.0), Michigan (4.9), and North Carolina (4.9). The lowest insured unemployment rates were in Virginia (1.8), Texas (2.2), Georgia (2.9), Florida (3.1), Maryland (3.2), Wyoming (3.2), Ohio (3.5), New York (3.7) and Maine (3.9). These data are not seasonally adjusted but the overall insured unemployment rate is.
The unemployment insurance claims data is available in Haver's WEEKLY database and the state data is in the REGIONW database.
Employment Survey Delivers JOLTS from the Federal Reserve Bank of Atlanta can be found here.
| Unemployment Insurance (000s) | 04/24/10 | 04/17/10 | 04/10/10 | Y/Y | 2009 | 2008 | 2007 |
|---|---|---|---|---|---|---|---|
| Initial Claims | 448 | 459 | 480 | -28.1% | 572 | 419 | 321 |
| Continuing Claims | -- | 4,645 | 4,663 | -25.2% | 5,809 | 3,340 | 2,549 |
| Insured Unemployment Rate (%) | -- | 3.6 | 3.6 | 4.6(4/2009) | 4.4 | 2.5 | 1.9 |
by Robert Brusca April 29, 2010
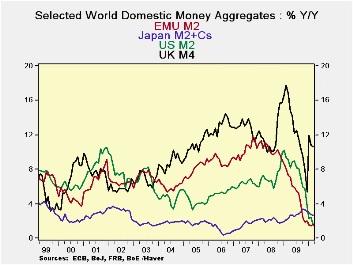
Money growth rates in Europe are starting to edge higher, but ever so slowly. At a 2.2% annual rate pace over three months compared to a 1.5% pace Yr/Yr is not much of an acceleration. Credit growth is however weaker over three months than over 12-months. In the US money growth is decelerating. In Japan it’s decelerating. In the UK, where inflation has started to flash some less than comfortable numbers, there is an issue. Money growth is in a major acceleration in the UK for M4 which is up at nearly a 40% annual rate pace over three months.
While the growth rates are different, the main themes remain in tact when we look at the growth rates of real money balances - money growth deflated by inflation.
Basically money is not much of a stimulant anywhere except in the UK.
Still we have great concerns among some economists that the fiscal spending and coming monetary excesses (paradoxically, fiscal issues already are taking what must be regarded as a deflationary toll in Europe) will result in a bout of inflation. For the most part, market pricing does not see that risk. Some of the hardest-money economists still are very worried. Some worry that the economy will recover and banks will begin to loan and this excess of reserves at the Fed will be unleashed into something that can become a torrent of inflation.
Then, others among us worry about getting hit by meteors from outer space.
While a cyclical pick up in lending is something we do expect in every business cycle, right now bankers are hunkered down. It is very hard to see how they are going to turn the lending spigot from a slow drip to full throttle in some quick fashion. Bank lending committees are notoriously slow in shifting their policy stance. The US economy and the European economies have a huge amount of slack. Conservative hard-money economists also point out that a lot of capacity was destroyed in the economic downturn. They warn that capital may appear to be less utilized than it really is. While that is a good point it is largely academic. The amount of slack in the economy is so great it’s like warning that the other rim of the Grand Canyon might be five feet closer than we thought so be careful about what might want to ‘fit inside of it.’
There will come a time to worry about these things. But unemployment in Europe is high. In the US 8.5 million people net were taken off the job rolls. In addition, many first-time job seekers were not able to find work. There is a great deal of slack. Money supply growth is slow. Europe’s fiscal situation has deteriorated making it a drag on the outlook despite some recent upbeat reports on growth. The question of the role of the deterioration in confidence in the e-Zone will play out over months not over hours. The US has its own fiscal challenge which will make public policy more contractionary ahead. Why all the worry about excess stimulus and inflation?
For the time being, despite high oil prices and some pressures on commodity prices, we have to signal the ‘all clear’ on the inflation front. Not enough growth remains as the near term clear and present danger. Inflation always lurks but it is, for the moment, unarmed and not very dangerous. Inflation is more lost in the woods and confused than it is dangerously lurking in some dark alley-way to mug an unsuspecting policymaker.
| Look at Global and Euro Liquidity Trends | |||||||
|---|---|---|---|---|---|---|---|
| Saar-all | Euro Measures (E13): Money & Credit | G-10 Major Markets: Money | Memo | ||||
| €-Supply M2 | Credit:Resid | Loans | $US M2 | £UK M4 | ¥Jpn M2+Cds | OIL:WTI | |
| 3-MO | 2.2% | -0.6% | 0.8% | -1.5% | 39.5% | 1.8% | 38.3% |
| 6-MO | 0.9% | -0.7% | 0.1% | 1.4% | 19.5% | 2.1% | 35.8% |
| 12-MO | 1.6% | -0.1% | -0.5% | 1.5% | 10.6% | 2.6% | 70.1% |
| 2Yr | 4.5% | 2.5% | 1.5% | 5.3% | 13.7% | 2.4% | -12.2% |
| 3Yr | 6.4% | 5.9% | 4.6% | 5.9% | 13.0% | 2.4% | 10.1% |
| Real Balances: deflated by Own CPI. Oil deflated by US CPI | |||||||
| 3-MO | 0.3% | -2.5% | -1.1% | -2.4% | 32.8% | 0.6% | 37.0% |
| 6-MO | -1.4% | -2.9% | -2.1% | -0.3% | 14.7% | 1.9% | 33.6% |
| 12-MO | 0.2% | -1.6% | -1.9% | -0.9% | 7.0% | 3.7% | 66.1% |
| 2Yr | 3.4% | 1.5% | 0.5% | 4.2% | 10.2% | 3.1% | -13.1% |
| 3Yr | 4.5% | 4.0% | 2.6% | 3.9% | 9.8% | 2.4% | 8.0% |
| Japan's March CPI is estimated to complete this table; The February value is used | |||||||

Tom Moeller
AuthorMore in Author Profile »Prior to joining Haver Analytics in 2000, Mr. Moeller worked as the Economist at Chancellor Capital Management from 1985 to 1999. There, he developed comprehensive economic forecasts and interpreted economic data for equity and fixed income portfolio managers. Also at Chancellor, Mr. Moeller worked as an equity analyst and was responsible for researching and rating companies in the economically sensitive automobile and housing industries for investment in Chancellor’s equity portfolio. Prior to joining Chancellor, Mr. Moeller was an Economist at Citibank from 1979 to 1984. He also analyzed pricing behavior in the metals industry for the Council on Wage and Price Stability in Washington, D.C. In 1999, Mr. Moeller received the award for most accurate forecast from the Forecasters' Club of New York. From 1990 to 1992 he was President of the New York Association for Business Economists. Mr. Moeller earned an M.B.A. in Finance from Fordham University, where he graduated in 1987. He holds a Bachelor of Arts in Economics from George Washington University.
More Economy in Brief


