 Global| Mar 23 2009
Chicago Fed Index Improved Marginally During February
by:Tom Moeller
|in:Economy in Brief
Summary
The National Activity Index (CFNAI) for February from the Chicago Federal Reserve Bank rose slightly month-to-month but remained depressed. At -2.83 the figure contrasted with January's near-record low of 3.48. Since 1970 there has [...]
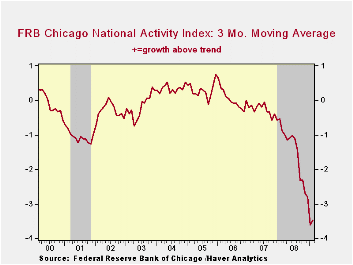
The National Activity Index (CFNAI) for February from the Chicago Federal Reserve Bank rose slightly month-to-month but remained depressed. At -2.83 the figure contrasted with January's near-record low of 3.48. Since 1970 there has been a 75% correlation between the level of the index and the q/q change in real GDP.
The three-month moving average of the index of -3.48 was near its lowest since January of 1975.
An index level at or below -0.70 typically has indicated negative U.S. economic growth. A zero value of the CFNAI indicates that the economy is expanding at its historical trend rate of growth of roughly 3%.
The complete CFNAI report is available here and the historical data are available in Haver's SURVEYS database.
Three of the four sub-categories of the index including employment, production, and consumption & housing improved slightly from January but remained at a depressed level. Seventy three of the individual indicators in the overall series made negative contributions while twelve made a positive contribution.
The CFNAI is a weighted average of 85 indicators of economic activity. The indicators reflect activity in the following categories: production & income, the labor market, personal consumption & housing, manufacturing & trade sales, and inventories & orders.
In a separate survey, the Chicago Fed indicated that its Midwest manufacturing index fell during January to its lowest level since 1994. Indicators for the steel, machinery and auto sectors each fell but the measure for the resource sector was stable.
The Chicago Federal Reserve figures are available in Haver's SURVEYS database.
Preliminary Analysis of the President's Budget and an Update of CBO's Budget and Economic Outlook from the Congressional Budget Office can be found here.
| Chicago Fed | February | January | February '08 | 2008 | 2007 | 2006 |
|---|---|---|---|---|---|---|
| CFNAI | -2.83 | -3.74 | -1.31 | -1.78 | -0.36 | 0.02 |
| 3-Month Average | -3.48 | -3.61 | -0.89 | -- | -- | -- |
by Tom Moeller March 23, 2009
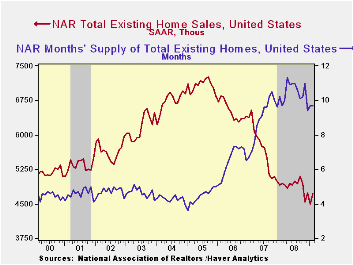
Sales may indeed respond to prices. That seemed the case according to the National Association of Realtors report on sales of existing homes. They rose 5.1% during February 4.72M and the increase reversed January's decline. Consensus expectations had been for February sales of 4.45M homes. Total sales include sales of condos and co-ops. In each of the country's regions sales during February roughly recovered their January declines.
Did continued weakness in pricing power spur the February recovery? Median home prices did rise 0.4% from January. The uptick followed, however, a revised 6.2% (NSA) January decline which was double the initial estimate. The recent weakness in prices left them 15.5% below February of last year and prices have fallen 28.2% since their peak. Declines in home prices and lower interest rates have gone a long way to increase the affordability of an existing home which is up roughly one quarter from one year ago. The measure rose to a record high for the series which dates back to 1971.
For existing single-family homes alone sales recovered most of
their January decline with a 4.4% rise to 4.230M units. However, that
remained near the lowest level since July 1997. Is the earlier decline
in sales forming a bottom? They have been essentially flat for the last
four months. (These data have a longer history than the total series).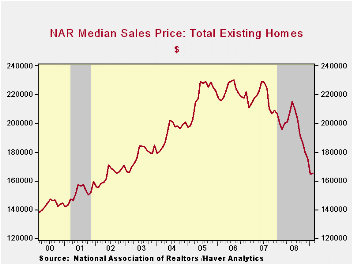
The number of unsold homes (condos & single-family) on the market increased a slight 5.2% during February but the year-to-year decline of 5.5% may eventually give some lift to home prices. At the current sales rate there was a 9.7 months' supply on the market which was near the lowest since 2007. For single-family homes the inventory also rose a modest 2.6% (-6.7% y/y) after little change during January. At the current sales rate there was a 9.1 month's supply, near the lowest since 2007.
The data on existing home sales, prices and affordability can be found in Haver's USECON database. The regional price, affordability and inventory data is available in the REALTOR database.
The "fact sheet" for the Public-Private Investment Program from the U.S. Treasury Department is available here.
House Prices and Bank Loan Performance from the Federal Reserve Bank of San Francisco can be found here.
| Existing Home Sales (Thous) | February | January | February y/y % | February '08 | 2008 | 2007 | 2006 |
|---|---|---|---|---|---|---|---|
| Total | 4,720 | 4,490 | -4.6 | 4,950 | 4,893 | 5,674 | 6,516 |
| Northeast | 740 | 640 | -14.9 | 870 | 845 | 1,010 | 1,093 |
| Midwest | 1,040 | 1,030 | -14.0 | 1,210 | 1,130 | 1,331 | 1,494 |
| South | 1,740 | 1,640 | -11.2 | 1,960 | 1,860 | 2,243 | 2,577 |
| West | 1,200 | 1,170 | 30.4 | 920 | 1,064 | 1,095 | 1,357 |
| Single-Family | 4,230 | 4,050 | -3.6 | 4,390 | 4,341 | 4,960 | 5,712 |
| Median Price, Total, $ | 165,400 | 164,800 | -15.5 | 195,800 | 197,250 | 216,633 | 222,042++ |
by Louise Curley March 23, 2009
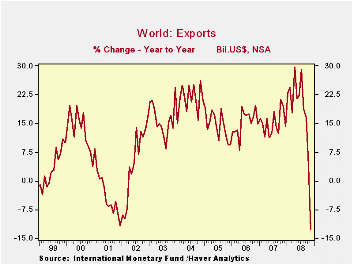
World trade began to decelerate early in 2008 reflecting the impact of the world wide slow down, but did not actually decline until November, the latest data available in Haver's IFS (International Monetary Fund Data) database. As shown in the first chart, the year-to-year decline in world exports was 13% in November. Since then more countries have released trade data most of it suggesting further sharp declines.
 Today foreign trade data for the Euro Area, as a whole, was
released for January 2009. (The data exclude intra euro area trade.)
Eurostat reported that the sixteen country area experienced
year-to-year declines of 7% in exports in December and 22% in January.
It also reported its second highest trade deficit of 5,460 million
euros with the rest of the world.
Today foreign trade data for the Euro Area, as a whole, was
released for January 2009. (The data exclude intra euro area trade.)
Eurostat reported that the sixteen country area experienced
year-to-year declines of 7% in exports in December and 22% in January.
It also reported its second highest trade deficit of 5,460 million
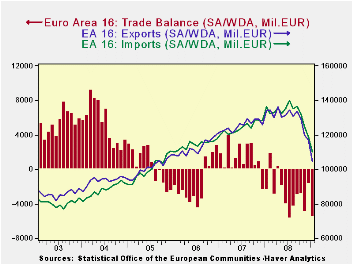
euros with the rest of the world. 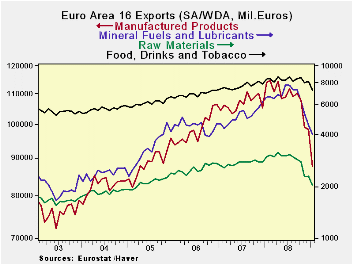 The balance of trade in the area has
fallen rapidly since February 2008, when the last appreciable surplus
was registered. Exports fell 29,815 million euros and imports fell
22,505 million euros resulting in a deterioration of 7,310 million
euros in the balance of trade--from a surplus of 1,850 million euros to
a deficit of 5,460 million euros. The trends in exports, imports and
the balances can be seen in the second chart.
The balance of trade in the area has
fallen rapidly since February 2008, when the last appreciable surplus
was registered. Exports fell 29,815 million euros and imports fell
22,505 million euros resulting in a deterioration of 7,310 million
euros in the balance of trade--from a surplus of 1,850 million euros to
a deficit of 5,460 million euros. The trends in exports, imports and
the balances can be seen in the second chart.
Manufactured exports were the hardest hit as can be seen in
the third chart that shows exports of manufactured products, 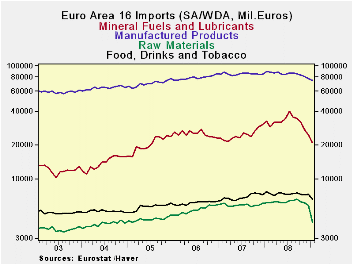 mineral
fuels and lubricants, raw materials and food, drink and tobacco on a
log scale where changes reflect percentage changes.
mineral
fuels and lubricants, raw materials and food, drink and tobacco on a
log scale where changes reflect percentage changes.
The rise and fall in oil prices that accounted for the sharp rise and fall in fuel imports over the past few years is evident in the fourth chart, also on a log scale. The peak in imports of fuels was reached in July 2008.
| EURO AREA-16 (Million Euros) | Jan 09 | Feb 08 | Change | 2007 | 2008 |
|---|---|---|---|---|---|
| Exports | 104550 | 134365 | -29815 | 1561690 | 1505903 |
| Imports | 110010 | 132515 | -22505 | 1592935 | 1490001 |
| Balance | -5460 | 1850 | -7320 | -31245 | 15902 |
| Manufactured Products Exports | 87736 | 114590 | -26854 | 1306908 | 1280612 |
| Mineral Fuels, & Lubricants Imports | 21068 | 39644* | -18576 | 385314 | 297024 |
| * July 2008 Peak |

Tom Moeller
AuthorMore in Author Profile »Prior to joining Haver Analytics in 2000, Mr. Moeller worked as the Economist at Chancellor Capital Management from 1985 to 1999. There, he developed comprehensive economic forecasts and interpreted economic data for equity and fixed income portfolio managers. Also at Chancellor, Mr. Moeller worked as an equity analyst and was responsible for researching and rating companies in the economically sensitive automobile and housing industries for investment in Chancellor’s equity portfolio. Prior to joining Chancellor, Mr. Moeller was an Economist at Citibank from 1979 to 1984. He also analyzed pricing behavior in the metals industry for the Council on Wage and Price Stability in Washington, D.C. In 1999, Mr. Moeller received the award for most accurate forecast from the Forecasters' Club of New York. From 1990 to 1992 he was President of the New York Association for Business Economists. Mr. Moeller earned an M.B.A. in Finance from Fordham University, where he graduated in 1987. He holds a Bachelor of Arts in Economics from George Washington University.
More Economy in Brief


