 Global| Feb 23 2009
Chicago Fed Index Fell Further
by:Tom Moeller
|in:Economy in Brief
Summary
The January National Activity Index (CFNAI) from the Chicago Federal Reserve Bank remained depressed at -3.45 after December's level of -3.65. The December figure was revised lower from the initial estimate and the latest numbers were [...]
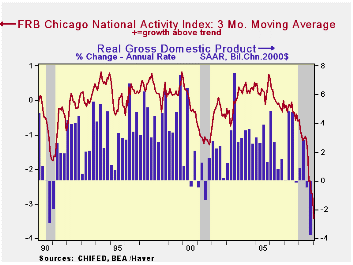
The January National Activity Index (CFNAI) from the Chicago Federal Reserve Bank remained depressed at -3.45 after December's level of -3.65. The December figure was revised lower from the initial estimate and the latest numbers were near the series' historic low. Since 1970 there has been a 75% correlation between the level of the index and the q/q change in real GDP.
The three-month moving average of the index of -3.41 was its lowest since January of 1975.
An index level at or below -0.70 typically has indicated negative U.S. economic growth. A zero value of the CFNAI indicates that the economy is expanding at its historical trend rate of growth of roughly 3%.
The complete CFNAI report is available here and the historical data are available in Haver's SURVEYS database.
Each of the four sub-categories of the index including employment, production, income, consumption & housing made a negative contribution to the January index. Sixty two of the individual indicators in the overall series made negative contributions while twenty three made a positive contribution.
The CFNAI is a weighted average of 85 indicators of economic activity. The indicators reflect activity in the following categories: production & income, the labor market, personal consumption & housing, manufacturing & trade sales, and inventories & orders.
In a separate survey, the Chicago Fed indicated that its Midwest manufacturing index fell during December to its lowest level since late 1996. Indicators for the steel, machinery, resource and auto sectors each fell.
The Chicago Federal Reserve figures are available in Haver's SURVEYS database.
Today's Joint Statement by the Treasury, FDIC, OCC, OTS, and the Federal Reserve can be found here.
| Chicago Fed | January | December | January '08 | 2008 | 2007 | 2006 |
|---|---|---|---|---|---|---|
| CFNAI | -3.45 | -3.65 | -0.55 | -1.77 | -0.37 | 0.01 |
| 3-Month Average | -3.41 | -2.70 | -0.55 | -- | -- | -- |
Economists Forecast Moderate Rebound in Second Half
by Tom Moeller February 23, 2009
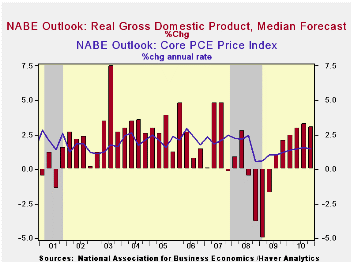
A survey of 47 top economic forecasters released today indicates that the current U.S. recession should end in the second half of this year. The subsequent recovery would start quite slowly, compared to historic norms, then pick up steam during 2010.
The National Association for Business Economics indicated in its latest survey that positive growth in U.S. GDP would resume in 3Q of this year at a 1.0% rate. For the second half of 2009 as a whole, the average forecasted rate of growth of 1.5% is on a par with the recoveries from the moderate recessions of 1990 and 2001. However, the recovery falls well short of growth after the more severe recessions, such as those in 1960, 1974 and 1982.
Improved (2.2%) growth in personal consumption expenditures
and a recovery in residential building are expected to lead the economy
from recession. The gains are expected to be moderate, however,
compared to sharp rebounds typical of the postwar period. Business
investment is expected to continue to decline sharply in 2010.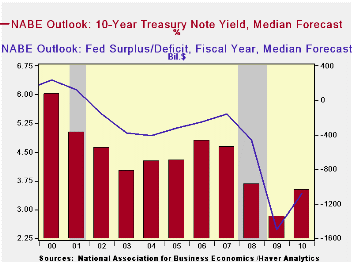
Corporate profits also are forecasted to rise in 2010 at a 7.3% rate, which would just reverse this year's decline. Again, that rebound is quite moderate compared to prior periods.
Inflation during the forecast period is expected to remain quite tame. Growth in the core PCE chained price index is expected to amount to roughly 1.0% for the rest of this year as the recession continues and the level of excess capacity remains high. The economic recovery next year as well as this year's significant injection of liquidity (money) by the Fed is forecasted to raise prices by 2010 at a quickened rate.
The bond market is forecasted to deteriorate next year with rates on the 10-year treasury rising to an average 3.8% from 3.1% this year. The catalysts for this deterioration are economic improvement as well as a significant rise in the federal budget deficit ($1.5 trillion this year and $1.1 billion in 2010) which could give rise to "crowding out" and higher inflation. In the foreign exchange market, the dollar's value is expected to remain roughly stable.
The forecast figures from the National Association of Business Economists are available in Haver's SURVEYS database.
| Nat'l Assn. for Business Economics | 1Q'09 | 2Q '09 | 3Q '09 | 4Q 09 | 2008 | 2009 | 2010 |
|---|---|---|---|---|---|---|---|
| Real GDP (%) | -5.0 | -1.7 | 1.0 | 2.1 | -0.2 | -0.9 | 3.0 |
| "Core" PCE Chained Price Index (%) | 0.6 | 1.0 | 1.0 | 1.2 | 1.8 | 0.9 | 1.5 |
Can The Baltic States Hold TheirCurrency Pegs?
by Louise Curley February 23, 2009
The Baltic States--Estonia, Latvia and Lithuania--have, in
recent years, pegged their currencies to the euro. Until recently, this
arrangement had proved economically satisfactory to the three nations.
However, as the deterioration in the world wide economy began to affect
these countries, the fact that their currencies were pegged to a
strengthening euro only exacerbated their problems.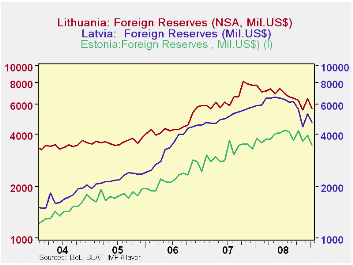
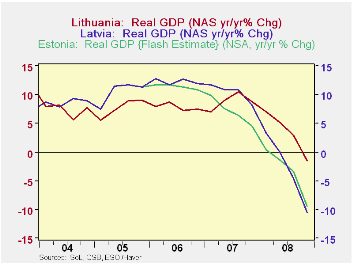
The first chart shows the year over year changes in real GDP for the three countries. Final data for the fourth quarter of 2008 for Estonia are not yet available, but the preliminary "flash" estimate is for a decline of 9.4% from the fourth quarter of 2007. Published data for Latvia's fourth quarter GDP shows a year over year decline of 10.5% while that for Lithuania's GDP is only 1.5%.
All three countries have used their foreign reserves to maintain their pegs with the euro as can be seen in the second chart that shows the recent declines in the foreign reserves of the three countries. Latvia spent more than $1.5 billion of its foreign reserves, defending its currency and was forced to apply for help from an International Monetary Fund led group for a $9.6 billion bailout. Both Latvia and Lithuania have cut wages of state employees Latvia by 15% and Lithuania by 12%. Now, Estonia is considering wage cuts of 10% for state employees except policemen and teachers. These measures have led to riots and political unrest. Once again the permanency of currency board systems in the face of austerity is being tested.
| BALTIC STATES | Jan 09 | Dec 08 | Nov 08 | Oct 08 | Sep 08 |
|---|---|---|---|---|---|
| Foreign Reserves (Mil. USD) | |||||
| Lithuania | 5683 | 6441 | 5537 | 6340 | 6505 |
| Latvia | 4695 | 5248 | 4447 | 5592 | 6239 |
| Estonia | 3462 | 3971 | 3646 | 4183 | 3681 |
| Q4 08 | Q3 08 | Q2 08 | Q1 08 | ||
| Year over Year Chg in Real GDP % | |||||
| Lithuania | -1.48 | 2.95 | 5.19 | 7.01 | -- |
| Latvia | -10.50 | -4.57 | 0.07 | 3.31 | -- |
| Estonia | -9.4 | -3.3 | -1.4 | 0.4 | -- |
Italy's Inflation Rates Show Turnof Trend
by Robert Brusca February 23, 2009
Italy’s headline HICP inflation rate fell by 0.6% in January.
Its domestic inflation measure fell by 0.2%. Both series show that
inflation has dropped sharply. The Yr/Yr pace for the HICP, or
harmonized rate, is 1.4% down from 3.2% a year ago at this time. The
domestic rate at 1.6% is down from 3% one year ago.
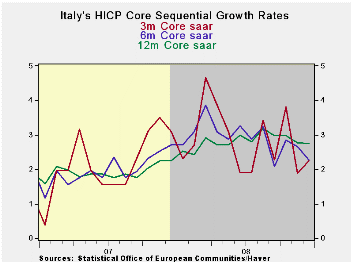
Our diffusion calculations (see table above) show that over
three-months and six-months inflation has been decelerating across more
sectors that it has been accelerating (a value of 50 is neutral; below
that inflation is decelerating in more sectors than it is
accelerating). The deceleration noted by the diffusion indices is
pronounced. It is not just due to a drop in energy prices.
| Italy HICP and CPI details | |||||||
|---|---|---|---|---|---|---|---|
| Mo/Mo % | Saar % | Yr/Yr | |||||
| Jan-09 | Dec-08 | Nov-08 | 3-Mo | 6-Mo | 12-Mo | Yr Ago | |
| HICP Total | -0.6% | 0.0% | -0.5% | -4.0% | -0.9% | 1.4% | 3.2% |
| Core | #N/A | 0.2% | 0.1% | #N/A | #N/A | #N/A | 2.5% |
| CPI | |||||||
| All | -0.2% | -0.1% | -0.4% | -2.6% | -0.9% | 1.6% | 3.0% |
| Food | 0.0% | 0.0% | 0.1% | 0.3% | 1.6% | 3.8% | 4.5% |
| Alcohol | -0.3% | 0.3% | 0.3% | 1.1% | 3.1% | 3.2% | 4.5% |
| Clothing & Shoes | 0.1% | 0.1% | 0.1% | 1.5% | 1.5% | 1.6% | 1.6% |
| Rent &Util | -0.9% | 0.2% | -0.3% | -3.7% | -1.1% | 4.1% | 4.0% |
| Housing &Furniture | 0.2% | 0.2% | 0.0% | 1.5% | 2.3% | 2.2% | 3.7% |
| Health Care | 0.2% | 0.1% | 0.0% | 1.3% | 1.7% | 0.8% | 0.7% |
| Transport | -0.7% | -1.0% | -2.1% | -14.5% | -9.0% | -1.5% | 5.5% |
| Communication | -0.4% | 0.1% | -0.1% | -1.8% | -4.0% | -3.2% | -8.5% |
| Rec &Culture | -0.2% | 0.1% | 0.1% | 0.0% | -1.0% | 0.6% | 0.7% |
| Education | 0.1% | 0.1% | 0.1% | 1.7% | 1.9% | 2.2% | 2.3% |
| Restaurant & Hotel | -0.3% | 0.0% | 0.2% | -0.3% | 0.5% | 1.9% | 2.5% |
| Other | 0.2% | 0.2% | -0.1% | 1.4% | 2.5% | 2.5% | 3.0% |
| Diffusion | -- | -- | -- | 16.7% | 16.7% | 33.3% | -- |
| Type: | Diffusion: Compared to | 6-mo | 12-mo | Yr-Ago | -- | ||

Tom Moeller
AuthorMore in Author Profile »Prior to joining Haver Analytics in 2000, Mr. Moeller worked as the Economist at Chancellor Capital Management from 1985 to 1999. There, he developed comprehensive economic forecasts and interpreted economic data for equity and fixed income portfolio managers. Also at Chancellor, Mr. Moeller worked as an equity analyst and was responsible for researching and rating companies in the economically sensitive automobile and housing industries for investment in Chancellor’s equity portfolio. Prior to joining Chancellor, Mr. Moeller was an Economist at Citibank from 1979 to 1984. He also analyzed pricing behavior in the metals industry for the Council on Wage and Price Stability in Washington, D.C. In 1999, Mr. Moeller received the award for most accurate forecast from the Forecasters' Club of New York. From 1990 to 1992 he was President of the New York Association for Business Economists. Mr. Moeller earned an M.B.A. in Finance from Fordham University, where he graduated in 1987. He holds a Bachelor of Arts in Economics from George Washington University.
More Economy in Brief


