 Global| Feb 23 2004
Changing Patterns in Japanese Export Trade
Summary
On a seasonally adjusted basis, Japanese exports rose 0.91% in January from December. Imports were up 1.81% at the same time. As a result, the surplus declined from 1.1 trillion yen in December to l.0 trillion in January. The December [...]
On a seasonally adjusted basis, Japanese exports rose 0.91% in January from December. Imports were up 1.81% at the same time. As a result, the surplus declined from 1.1 trillion yen in December to l.0 trillion in January. The December surplus was the highest since March,1999.
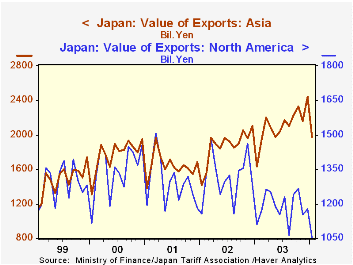
The pattern of Japanese export trade has been changing. Since details regarding the direction of trade are available only on a non-seasonally adjusted basis, year over year changes are more meaningful than month over month changes. The year over year changes in January continue to show the same trends in trade flows that became apparent in 2003. For the year 2003, as a whole, exports to Asia, Western Europe, Eastern Europe and Oceania increased, in some cases dramatically, while exports to North and South America declined.
| Japanese Trade (Billion Yen) | Jan 04 | Dec 03 | Jan 03 | M/M % |
Y/Y % |
2003 % | 2002 % | 2001 % |
|---|---|---|---|---|---|---|---|---|
| Exports SA | 4888.0 | 4844.1 | 4367.5 | 0.91 | 11.92 | 4.82 | 6.23 | -4.61 |
| Imports SA | 3789.5 | 3721.9 | 3650.6 | 1.81 | 3.63 | 5.08 | -0.28 | 3.30 |
| Balance SA | 1019.5 | 1122.3 | 716.9 | -2.12 | 53.23 | -35.61 | 42.07 | 3.75 |
| Exports NSA | 4277.7 | 4958.0 | 3842.7 | -13.72 | 16.32 | 4.71 | 6.39 | -5.18 |
| North America | 1053.3 | 1178.7 | 1109.7 | -10.63 | -5.08 | -9.65 | 1.80 | -4.04 |
| Central and South Amer | 163.4 | 140.5 | 154.704 | 16.28 | 5.62 | -5.29 | -6.09 | -4.29 |
| Western Europe | 752.4 | 801.5 | 670.6 | -6.13 | 12.20 | 9.36 | -1.95 | -7.49 |
| Eastern Europe inc Russia | 52.5 | 58.7 | 31.6 | -10.50 | 66.37 | 52.33 | 22.65 | 9.31 |
| Middle East | 117.5 | 149.1 | 102.9 | -21.17 | 14.18 | 4.67 | 11.46 | 21.96 |
| Asia | 1975.3 | 2444.7 | 1635.1 | -19.20 | 20.80 | 12.87 | 13.72 | -7.16 |
| Africa | 55.3 | 62.6 | 42.6 | -11.68 | 29.77 | 5.09 | 14.07 | -1.06 |
| Oceania | 108.0 | 122.1 | 95.5 | -11.54 | 13.05 | 11.23 | 12.95 | 1.57 |
More Economy in Brief


