 Global| Jun 06 2007
Challenger Lay Offs Stay Elevated
Summary
The first issue to grapple with in trying to assess the Challenger report is that its data are not seasonally adjusted. At the same time it is clear that this series has seasonal patterns. To get around this we compare the data to the [...]
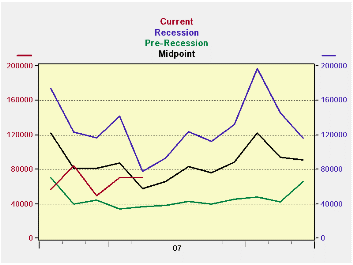
The first issue to grapple with in trying to assess the Challenger report is that its data are not seasonally adjusted. At the same time it is clear that this series has seasonal patterns. To get around this we compare the data to the year before.. We also have created the accompanying chart that plots each month of the year in a non-binding tunnel bearing two values representing averages for each month drawn from the period of recession and depressed growth as well as from the pre-recession times when layoffs were much lower. We add, as another reference line to the chart, the midpoint between these two cases. The chart reveals that the 2007 figures were regularly at or below the midpoint line until May when the level of layoffs is higher relative to that standard. It may be that the economy is throwing off more layoffs in May than what is normal either because of calendar quirks or because of a real deterioration that is setting in.
But the chart, even though it uses NSA data, flags May 2007 as a month of backtracking on reducing layoffs.
The comprehensive table below provides even more comparisons. May ranks as the fifth highest layoff total in the past 14 years. April was also the fifth highest layoff month. March had ranked 9th and layoffs appeared as if they were diminishing. The three-month average ranks sixth over these same 14 years. The six-month average ranks eighth. The 12-month is displayed in the table and as of May that ranks 8th. So the ranking has been creeping up as we shorten the length to measure the moving average or to look at the month directly. The improving trend is not so clear any more, indeed it appears to have switched to one of deterioration. We can see that there has been some slippage compared to historic standards; standards that are free from the effects of seasonality.
A slight bump up in the layoff pace is not an unequivocal message.
But the steadiness of the slippage of the rankings on shorted moving averages is indicative of a true deterioration. A pick up in layoffs need not be a sign of economic weakness, however. At the moment both jobless claims and nonfarm job growth are indicating that the job market is solid – as is the 4.5% rate of unemployment. Layoffs are another way to supply labor to an already tight labor market. We know that manufacturing firms continue to shed employees and have been doing so for decades. With the pick up in M&A activity it is no surprise that layoffs step-up since that is one common result of mergers and their drive for greater efficiency.
The gradual up turn in layoffs is a trend to be aware of, but is not yet a clear signal for policy. It may be constructive or it may be a sign of true erosion and of encroaching weakness. It bears watching.
| Rank of | "13-Yr" | |||||||
|---|---|---|---|---|---|---|---|---|
| Challenger, Gray and Christmas: | 3-Mo Avg | 6-Mo Avg | 12-Mo Avg | 12-Mo | Rank Of | |||
| May | Apr | Mar | May | May | May | Average | May | |
| Announced Layoffs: 2007 | 71,115 | 70,672 | 48,997 | 63,595 | 65,736 | 67,523 | 8 | 5 |
| Same Mo. Year ago (2006): | 53,716 | 59,688 | 64,975 | 59,460 | 79,514 | 84,503 | 6 | 9 |
| Same Mo. Year ago (2005): | 82,283 | 57,861 | 86,396 | 75,513 | 89,387 | 88,218 | 5 | 2 |
| Same Mo. 2-Years ago (2004): | 73,368 | 72,184 | 68,034 | 71,195 | 83,569 | 89,500 | 4 | 4 |
| Same Mo. 3-Years ago (2003): | 68,623 | 146,399 | 85,396 | 100,139 | 110,622 | 113,426 | 2 | 6 |
| Same Mo .4-Years ago (2002): | 84,978 | 112,649 | 102,315 | 99,981 | 139,686 | 154,906 | 1 | 1 |
| Same Mo.5-years ago (2001): | 80,140 | 165,564 | 162,867 | 136,190 | 131,037 | 74,439 | 7 | 3 |
| Same Mo.6-years ago (2000): | 27,036 | 37,291 | 55,783 | 40,037 | 41,644 | 103,205 | 3 | 12 |
| Same Mo.7-years ago (1999): | 55,231 | 54,399 | 68,984 | 59,538 | 70,553 | 65,201 | 9 | 8 |
| Same Mo.8-years ago (1998): | 27,631 | 48,758 | 23,028 | 33,139 | 45,637 | 39,950 | 11 | 11 |
| Same Mo.9-years ago (1997): | 21,004 | 15,214 | 50,182 | 28,800 | 34,646 | 31,851 | 13 | 13 |
| Same Mo.10-years ago (1996): | 30,845 | 30,810 | 37,486 | 33,047 | 47,598 | 41,526 | 10 | 10 |
| Same Mo.11-years ago (1995): | 58,530 | 15,678 | 27,809 | 34,006 | 33,240 | 35,253 | 12 | 7 |
| Comparative Data | May | Apr | Mar | Values for previous months | ||||
| Recession & Post Recession | 3-Mo | 6-Mo | 12-Mo | Month of | May | |||
| Median (3-Yrs) | 80,140 | 146,399 | 102,315 | 100,139 | 131,037 | 113,426 | tends to be | lower than |
| Pre-Recession (1995-2000) | Apr | 60.0% | ||||||
| Median (6-Yrs) | 29,238 | 83,524 | 77,190 | 79,759 | 90,588 | 88,822 | of the | time |
| MIDPOINT-Median | 54,689 | 114,962 | 89,753 | 89,949 | 110,812 | 101,124 | ||
| % of Pre & Post Gap | 82.3% | -20.4% | -112.2% | -79.3% | -61.4% | -86.6% | ||

Robert Brusca
AuthorMore in Author Profile »Robert A. Brusca is Chief Economist of Fact and Opinion Economics, a consulting firm he founded in Manhattan. He has been an economist on Wall Street for over 25 years. He has visited central banking and large institutional clients in over 30 countries in his career as an economist. Mr. Brusca was a Divisional Research Chief at the Federal Reserve Bank of NY (Chief of the International Financial markets Division), a Fed Watcher at Irving Trust and Chief Economist at Nikko Securities International. He is widely quoted and appears in various media. Mr. Brusca holds an MA and Ph.D. in economics from Michigan State University and a BA in Economics from the University of Michigan. His research pursues his strong interests in non aligned policy economics as well as international economics. FAO Economics’ research targets investors to assist them in making better investment decisions in stocks, bonds and in a variety of international assets. The company does not manage money and has no conflicts in giving economic advice.
More Economy in Brief


