 Global| Apr 05 2005
Chain Store Sales Recovered Slightly
by:Tom Moeller
|in:Economy in Brief
Summary
Chain store sales inched up 0.3% in the opening week of April and recovered a piece of the prior week's 1.0% drop according to the International Council of Shopping Centers (ICSC)-UBS survey. Sales began the month 0.2% below the March [...]
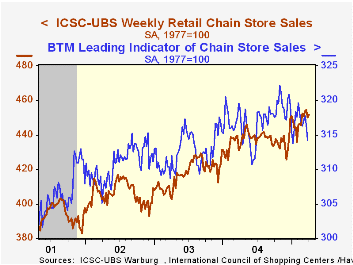
Chain store sales inched up 0.3% in the opening week of April and recovered a piece of the prior week's 1.0% drop according to the International Council of Shopping Centers (ICSC)-UBS survey.
Sales began the month 0.2% below the March average which rose 1.1% versus the prior month. That gain followed a strong 1.0% rise in February.
During the last ten years there has been a 56% correlation between the y/y change in chain store sales and the change in non-auto retail sales less gasoline, as published by the US Census Department. Chain store sales correspond directly with roughly 14% of nonauto retail sales less gasoline.
The leading indicator of chain store sales from ICSC fell 0.7% (-1.7% y/y) for the second consecutive weekly decline and pulled the measure 2.5% off its peak last year.
The ICSC-UBS retail chain-store sales index is constructed using the same-store sales (stores open for one year) reported by 78 stores of seven retailers: Dayton Hudson, Federated, Kmart, May, J.C. Penney, Sears and Wal-Mart.
| ICSC-UBS (SA, 1977=100) | 04/02/05 | 03/26/05 | Y/Y | 2004 | 2003 | 2002 |
|---|---|---|---|---|---|---|
| Total Weekly Chain Store Sales | 451.5 | 450.2 | 4.4% | 4.6% | 2.9% | 3.6% |
by Tom Moeller April 5, 2005
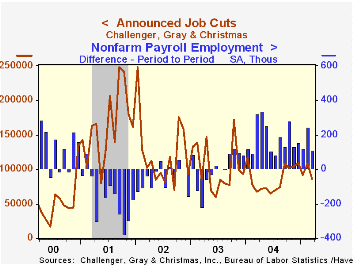
Challenger, Gray & Christmas reported that job cut announcements in March reversed the prior month's jump and fell 20.3%.
Challenger also reported that announced hiring plans fell sharply m/m to 18,509 jobs but the 1Q05 level rose by three quarters versus 4Q04.
During the last ten years there has been an 85% (inverse) correlation between the three month moving average of announced job cuts and the three month change payroll employment.
Job cut announcements fell sharply m/m in the consumer goods (-18.2% y/y), industrial goods (-27.1% y/y), telecommunication (-96.1% y/y) and transportation industries but declines elsewhere were limited.
Job cut announcements differ from layoffs. Many are achieved through attrition, early retirement or just never occur.
| Challenger, Gray & Christmas | Mar | Feb | Y/Y | 2004 | 2003 | 2002 |
|---|---|---|---|---|---|---|
| Announced Job Cuts | 86,396 | 108,387 | 27.0% | 1,039,175 | 1,236,426 | 1,431,052 |
by Louise Curley April 5, 2005
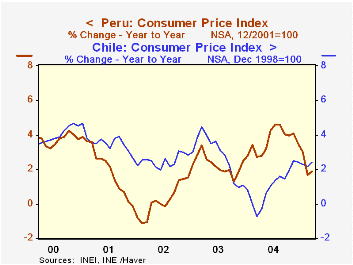
Many Latin America are experiencing relatively low rates of inflation as measured by the year to year percent change in the consumer price index. For example, the March inflation was 1.87% for Peru and 2.40% for Chile.(See the first chart.)
Even the 4-5% rates of inflation shown by Mexico, Colombia and Uruguay are not unusually high for emerging markets. Moreover, Colombia and Uruguay have shown good progress in reducing inflation over the past few years while Mexico has maintained a 4-5% range of inflation in the same time frame. (March data for Mexico are not yet available.)
Venezuela's inflation rose sharply as its oil bonanza and populist government led to big increases in consumer demand. It has since abated but is still among the highest in the area. Inflation in Argentina rose sharply, spiking at over 40% by late 2002 after it had abandoned its currency board. Inflation began to moderate subsequently and reached a low point of 2.26% in February, 2004. Since then, however, inflation has been rising sharply in Argentina. The second chart contrasts the recently declining trend of inflation in Venezuela with the rising trend in Argentina.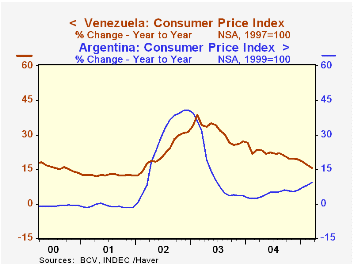
| Latin American Countries Y/Y % Change in CPI |
Mar 05 | Feb 05 | Mar 04 | M/M Dif | Y/Y Dif | 2004 | 2003 | 2002 |
|---|---|---|---|---|---|---|---|---|
| Argentina | 9.15 | 8.13 | 2.28 | 1.02 | 6.87 | 4.42 | 13.44 | 25.84 |
| Chile | 2.40 | 2.19 | -0.75 | 0.21 | 3.15 | 1.05 | 2.81 | 2.49 |
| Colombia | 5.03 | 5.24 | 6.28 | -0.21 | -1.25 | 5.90 | 7.13 | 6.35 |
| Peru | 1.87 | 1.68 | 3.43 | 0.19 | -1.56 | 3.66 | 2.26 | 0.19 |
| Uruguay | 5.48 | 5.66 | 8.38 | -0.18 | -2.90 | 9.16 | 19.38 | 13.97 |
| Venezuela | 15.80 | 16.81 | 21.88 | -1.06 | -6.08 | 21.75 | 31.09 | 22.43 |
| Mexico | n.a. | 4.27 | 4.23 | n.a | n.a. | 4.69 | 4.55 | 5.03 |

Tom Moeller
AuthorMore in Author Profile »Prior to joining Haver Analytics in 2000, Mr. Moeller worked as the Economist at Chancellor Capital Management from 1985 to 1999. There, he developed comprehensive economic forecasts and interpreted economic data for equity and fixed income portfolio managers. Also at Chancellor, Mr. Moeller worked as an equity analyst and was responsible for researching and rating companies in the economically sensitive automobile and housing industries for investment in Chancellor’s equity portfolio. Prior to joining Chancellor, Mr. Moeller was an Economist at Citibank from 1979 to 1984. He also analyzed pricing behavior in the metals industry for the Council on Wage and Price Stability in Washington, D.C. In 1999, Mr. Moeller received the award for most accurate forecast from the Forecasters' Club of New York. From 1990 to 1992 he was President of the New York Association for Business Economists. Mr. Moeller earned an M.B.A. in Finance from Fordham University, where he graduated in 1987. He holds a Bachelor of Arts in Economics from George Washington University.
More Economy in Brief


