 Global| Mar 04 2003
Chain Store Sales Recovered Only A Bit
by:Tom Moeller
|in:Economy in Brief
Summary
Chain store sales rose only 0.2% in the week following the President's Day snowstorm when sales dropped 0.8%, according to the BTM-UBSW survey. For the full month, sales in February fell 0.2% (-1.0% y/y) from the January average. [...]
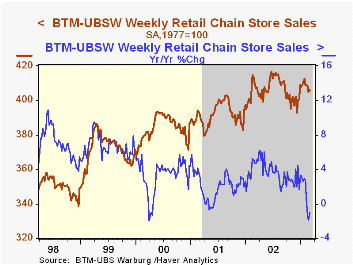
Chain store sales rose only 0.2% in the week following the President's Day snowstorm when sales dropped 0.8%, according to the BTM-UBSW survey.
For the full month, sales in February fell 0.2% (-1.0% y/y) from the January average.
During the last ten years there has been a 54% correlation between the year-to-year percent change in monthly chain store sales and the change in nonauto retail sales less gasoline.
| BTM-UBSW (SA, 1977=100) | 3/01/03 | 2/28/03 | Y/Y | 2002 | 2001 | 2000 |
|---|---|---|---|---|---|---|
| Total Weekly Retail Chain Store Sales | 405.9 | 405.2 | -1.0% | 3.6% | 2.1% | 3.4% |
by Tom Moeller March 4, 2003
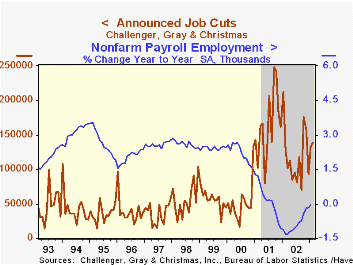
According to Challenger, Gray & Christmas, announced job cuts rose in February for the second consecutive month.
The three month moving average of job cut announcements fell 5.1% from the prior month and was 27.7% below the year ago level.
Job cut announcements differ from layoffs in that many are achieved through attrition or just never occur.
Announcements of job cuts rose sharply in the automotive, chemical, computer, electronics, government, insurance and services industries.
Job cut announcements fell in several other industries including transportation, telecommunication, retail, health care and consumer goods.
During the last ten years there has been a (negative) 73% correlation between the level of announced job cuts and the y/y percent change in nonfarm payrolls.
| Challenger, Gray & Christmas | Feb | Jan | Y/Y | 2002 | 2001 |
|---|---|---|---|---|---|
| Announced Job Cuts | 138,177 | 132,222 | 7.9% | 1,431,052 | 1,956,876 |
by Tom Moeller March 4, 2003
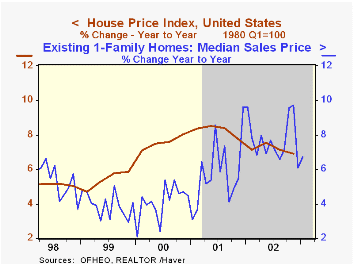
Prices for existing homes rose last quarter by the smallest degree in nearly five years according to the government's Office of Federal Housing Enterprise Oversight. For 3Q02, figures were revised up to show a 1.5% increase versus a 0.8% gain reported last quarter.
The data cover only home mortgages repurchased by Fannie Mae and Freddie Mac and therefore do not cover high priced homes with mortgages over roughly $300,000 (roughly 25% of the market).
The data correct for "mix shifts", i.e., changes in home quality, size and location.
The full press release from the Office of Federal Housing Enterprise Oversight can be viewed here.
| House Price Index | 4Q 02 | 3Q 02 | Y/Y | 2002 | 2001 | 2000 |
|---|---|---|---|---|---|---|
| US Total, Q/Q % | 0.8% | 1.4% | 6.9% | 7.2% | 8.2% | 7.6% |

Tom Moeller
AuthorMore in Author Profile »Prior to joining Haver Analytics in 2000, Mr. Moeller worked as the Economist at Chancellor Capital Management from 1985 to 1999. There, he developed comprehensive economic forecasts and interpreted economic data for equity and fixed income portfolio managers. Also at Chancellor, Mr. Moeller worked as an equity analyst and was responsible for researching and rating companies in the economically sensitive automobile and housing industries for investment in Chancellor’s equity portfolio. Prior to joining Chancellor, Mr. Moeller was an Economist at Citibank from 1979 to 1984. He also analyzed pricing behavior in the metals industry for the Council on Wage and Price Stability in Washington, D.C. In 1999, Mr. Moeller received the award for most accurate forecast from the Forecasters' Club of New York. From 1990 to 1992 he was President of the New York Association for Business Economists. Mr. Moeller earned an M.B.A. in Finance from Fordham University, where he graduated in 1987. He holds a Bachelor of Arts in Economics from George Washington University.
More Economy in Brief


