 Global| Apr 23 2007
CFNAI - Not Entirely Comforting
Summary
The index is not a leading index for activity. It was not even declining ahead of the 1973 recession, for example. But the Chicago Fed sees a different role for this index. On its web site the Chicago Fed says this: The 85 economic [...]
| · The Chicago Fed’s national activity Index is usually not much of a market mover. One reason is that this 85 indicator monster of an index has a very strong correlation to industrial production, a report that is released ahead of it. IP has an R-squared with the CFNAI of 0.77, quite high. That leaves only 23% of the variance in the index to be explained by the other 84 factors in the index. In other words, once you’ve got IP out of the way you largely know what the CFNAI is going to do. · The CFNAI index rose in March snapping a two month declining streak. The report has had a negative reading in five of its last seven months. |
|---|
| Selected Growth and Inflation Trends | |||
| Chicago Index | IP 3-Mo AR | Core CPI | |
| Mar-07 | 0.01 | 0.7 | 2.5 |
| Feb-07 | -0.11 | 2.1 | 2.7 |
| Jan-07 | -0.80 | 1.1 | 2.7 |
| Average | |||
| 3-Mo | -0.30 | 1.3 | 2.6 |
| 6-Mo | -0.23 | -0.2 | 2.7 |
| 12-Mo | -0.12 | 2.3 | 2.7 |
| 12 month averages from 12 months ago | |||
| 0.315 | 4.5 | 2.1 | |
The index is not a leading index for activity. It was not even declining ahead of the 1973 recession, for example. But the Chicago Fed sees a different role for this index.
On its web site the Chicago Fed says this: ‘The 85 economic indicators that are included in the CFNAI are drawn from four broad categories of data: production and income; employment, unemployment, and hours; personal consumption and housing; and sales, orders, and inventories. Each of these data series measures some aspect of overall macroeconomic activity. The derived index provides a single, summary measure of a factor common to these national economic data. The CFNAI corresponds to the index of economic activity developed by James Stock of Harvard University and Mark Watson of Princeton University in an article, "Forecasting Inflation," published in the Journal of Monetary Economics in 1999. The idea behind their approach is that there is some factor common to all of the various inflation indicators, and it is this common factor, or index, that is useful for predicting inflation. Research has found that the CFNAI provides a useful gauge on current and future economic activity and inflation in the United States.’
See: http://www.chicagofed.org/economic_research_and_data/cfnai.cfm
Since inflation is in the limelight what is this index saying about activity that might be useful for inflation-watchers?
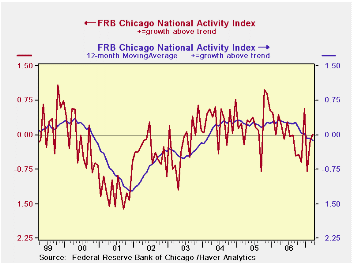
The chart on the left shows that the 12 month average of the Chicago activity index has been withering steadily. If the Fed takes this as an important barometer of inflation pressures, the index is saying that those pressures are abating and it explains why the Fed has been willing to sit tight with inflation over the top of its comfort zone.
Still, the same Chart offers a warning since the current month has brought a rebound in the index. If the declining phase of the index is over maybe the inflation alleviating aspects of this index have played out already?
Even so we can see that the Chicago Index has not kept a close correlation to Core CPI shifts recently. On reason undoubtedly is the key role that oil prices have played in the run-up of inflation.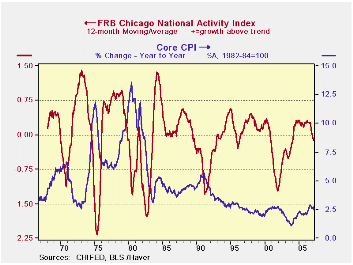
From the Fed’s point of view it is not clear that trends are still working in its favor. Compared to the twelve month average of one year ago, the recent 3-mo average of the Chicago activity index is lower at -0.30 compared to 0.315. On the same comparison growth has slowed to 1.3% for IP from 4.5%. But inflation on this basis has risen from 2.1% to 2.6% although it has been edging off peak. Inflation has been stubborn and has risen even as the activity index has moved lower (and gone negative) and even as industrial output soured.
The added problem in assessing inflation trends is that industrial production is now showing some life again. Although the recent CFNAI number is small if the direction for the index is now upward, that would raise questions about the future calming of inflation. It is far from clear the Chicago Activity index should be a source of solace to anyone at the Fed who is concerned about inflation.
Mortgage Lending Continues Strong in the UK, Particularly by Building Societiesby Louise Curley April 23, 2007
Mortgage lending data for the United Kingdom compiled by the Council of Mortgage Lenders (CML) and the Building Societies Association (BSA) were released today. In addition to building societies, the CML includes banks and others engaged in mortgage lending to individuals. Building societies account for roughly 18% of the total mortgage lending.
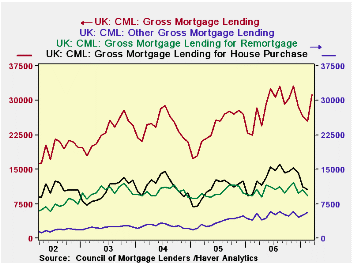
Gross mortgage lending reported by the CML was 31,260 million pounds in March, 22% above February and 10% above March of 2006. A breakdown of the mortgage lending total among house purchase, remortgage and other is not yet available for March, but in view of the sharp rise in the total of some 22%, the components should obviously show good rises as well, perhaps reversing the recent down trends in mortgages for house purchase and remortgages.The total and components are shown in the first chart. Since the figures are seasonally unadjusted, the month to month rise is less meaningful than the year to year rise.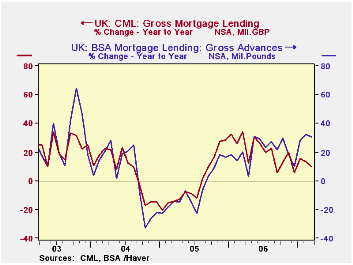
Gross advances for mortgages by the building societies (seasonally unadjusted to be comparable with the CML data) were 5,469 million pounds in March, a 30% increase over February and 30% over March 2006. In the last four month, the gap between the increases in mortgage lending by building societies and by all lenders has widened indicating that lending by building societies has been increasing faster than that by banks and other institutions.
The CML data are grossed up estimates based on a sample of lenders reflecting market size. The data since April, 2005 are based on product sales data reported to the CML; data prior to April, 2005 are taken from the Survey of Mortgage Lenders. There are differences in the methodologies and in the samples of lenders in the data before and after 2005.
| MORTGAGE LENDING IN THE UK | Mar 07 | Feb 07 | Mar 06 | M/M % | Y/Y % | 2006 % | 2005 % | 2004 % |
|---|---|---|---|---|---|---|---|---|
| CML Gross Lending (NSA Million Pounds) | 31,260 | 25,535 | 28,397 | 22.42 | 10.08 | 19.75 | -1.13 | 5.05 |
| BSA Gross Advances (NSA Million Pounds) |
5,469 | 4,214 | 4,199 | 29.78 | 30.25 | 20.97 | -7.35 | 1.52 |

Robert Brusca
AuthorMore in Author Profile »Robert A. Brusca is Chief Economist of Fact and Opinion Economics, a consulting firm he founded in Manhattan. He has been an economist on Wall Street for over 25 years. He has visited central banking and large institutional clients in over 30 countries in his career as an economist. Mr. Brusca was a Divisional Research Chief at the Federal Reserve Bank of NY (Chief of the International Financial markets Division), a Fed Watcher at Irving Trust and Chief Economist at Nikko Securities International. He is widely quoted and appears in various media. Mr. Brusca holds an MA and Ph.D. in economics from Michigan State University and a BA in Economics from the University of Michigan. His research pursues his strong interests in non aligned policy economics as well as international economics. FAO Economics’ research targets investors to assist them in making better investment decisions in stocks, bonds and in a variety of international assets. The company does not manage money and has no conflicts in giving economic advice.
More Economy in Brief


