 Global| Oct 28 2019
CBI Survey Has Bad News for the U.K. Retail Sector
Summary
The Confederation of British Industry distributive trades retail survey in November continues to show weakness. Weakness is built into the very bones of this survey from the basic line items of the month to the look-ahead survey [...]
 The Confederation of British Industry distributive trades retail survey in November continues to show weakness. Weakness is built into the very bones of this survey from the basic line items of the month to the look-ahead survey expectations. There is now a substantial legacy of weakness and the queue standings of the activity-related components are weak with all of them below their respective median values (all below a queue ranking of 50%).
Emphasizing that all is not well in retail-land is the confluence of low activity standings with high stock to sales ratios for both the current and expected survey portions. With sales and orders weak, the stock to sales ratio standing in its top 1%; that is a cry for help. But who is listening?
With expected sales for the time of year or expected sales and orders compared to their year ago values all posting weak readings, the expected stock-to-sales ratio has been higher only about 6% of the time historically. These metrics suggest that sales and orders have been weak and are expected to continue weak and that inventories currently are out of alignment (too high) and are expected to stay out of alignment in the period ahead. None of this is good for the U.K. economy as political factions continue to war over Brexit and as the Brexit horizon seems to become more distinct (I'm guessing here about Brexit as you can tell…).
The retail CBI by the numbers in October and for the November outlook
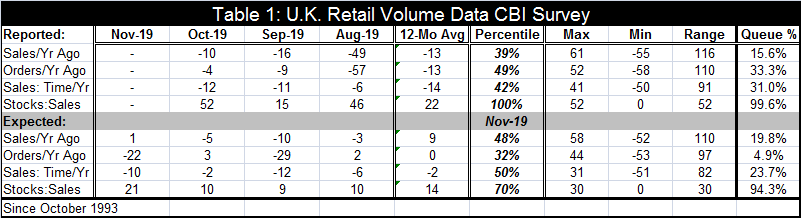
In October, there are net negative readings for sales compared to a year ago, for orders compared to a year ago, and for sales for the 'time-of-year.' In the outlook for November, there is a bare-bones +1 net positive reading for expected sales compared to one year ago, a negative reading for expected orders compared to a year ago and a negative reading for expected sales 'adjusted for the time of year.' And for both the current and expected surveys, the stock-to-sales ratios have significantly large positive readings.
Trends in the CBI survey
I should just print this entire paragraph in red ink for emphasis. The trends are and have been weak and trending weaker.
• Sales compared to a year ago: are negative from October back through May (6-months); they have only one positive reading in the last eleven months.
• Orders compared to a year ago: are negative also from October through May.
• Sales for the time of year: are negative October through May; they are also negative in 12 of the past 15 months.
• Expected sales compared to a year ago have a +1 value in October with negative readings in the previous four months. This suggests that it may have taken a while for actual weakness to become 'appreciated' and baked in the outlook.
• Expected orders compared to one year ago are negative in four of the past six months.
• Expected sales 'for the time of year' are negative for four months in a row.
• Stock-to-sales ratios whether in the current or expected survey each have extremely long strings of positive values. The stock sales ratios have been climbing and that is most obvious in the current survey.
The absolute readings in October or for the November outlook
The paragraphs above document the weakness in October and in the November outlook as well as the declining trends. However, the percentile standings take a snap shot of the current value and reflect it against each component's own history of results allowing us to understand the nature of the current reading more clearly. Table 1 shows that there are important 12-month difference in the averages of components as well as very different maximum and minimum readings among the components. For example, the expected stock:sales ratio varies only over a range of 30 while the current reading for sales compared to one year ago varies over a 116 point range for the same period. Clearly, some series are more volatile and some are less volatile; it is instructive to evaluate each component relative to its own history instead of just looking to see if the month's value is a net positive or a net negative. The queue percentiles perform this task well; they use the entire time-series of data back to May 1996 they evaluate the current month at its percentile standing in this queue of data. (By compassion, the column labeled 'Percentile' uses only three values to create a ranking the current value relative to the high and the low.)
Month-to-month (either September to October or October to November, depending on whether the series is a current or an expected component) half of the activity components weakened (sales strengthened in both the current and the expected portions of the survey and in the current portion orders also improved). But what did those shifts mean for the rankings?
For the components, that improved the rankings were still quite low. For example, the October queue standing for sales compared to one year ago as of October rises to 15.6% from an even lower 11%. Orders compared to one year ago rise to a 33% standing from a 24% standing in September. And sales for time of year worsened very slightly to a 31st percentile standing from a 33rd percentile standing. The more dramatic changes occur in the expected part of the survey. There the improvement for sales compared to one year ago does not change by much with the rank rising to a 19.8 percentile standing from a 13th percentile standing. But the slip in orders compared to a year ago shows a drop from a 41st percentile standing to a 4.9 percentile standing; that is a severe drop and shift in ranking. Sales for time of year drop from a net of -2 in October to -10 in November and that drop critically changes the ranking from a 40th percentile to a 23.7 percentile – substantially weaker.
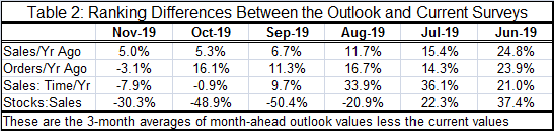
After noting that there were some sharp monthly changes, I generated the table below. It looks at the gap between the ranking for the current month and the ranking of the outlook value made at the same time. These gaps are based on their RANKINGS not their raw scores (which we know cannot be compared among components). The values in the table are three-month averages of these gap-metrics. The gaps are generated by subtracting from the smoothed outlook the smoothed current value.
We find the following generalizations:
• Sales one year ago have tended to have a stronger outlook value than a current value (table values are positive). But the premium of the outlook for the current reading has steadily been shrinking.
• Orders compared to a year ago also have tended to be stronger in their outlook than in their current survey. But that is no longer the case in November. The ranking premium was cut sharply back in July compared to June and had had been more or less consistent until this month. Now the order outlook is weaker than the current survey.
• Sales for time of year: this of course is the 'seasonally adjusted' concept. The outlook was consistently of a much stronger ranking until September and now for two months running the smoothed outlook rank is worse than the current assessment (ranking is lower generating a negative gap); this generates a negative reading in the table.
• The stock-to-sales ratios are generating negative values, indicating that the recent outlook standings are weaker than the current standings. That is reassuring as well as inevitable. The current stock-to-sales ranking has never been higher. And when that happens in the current reading, inevitably firms will look for some redress to that ahead.
On balance, we chronicle a lot of shifting and deterioration measured in a number of different dimensions. (1) there are net negative values; (2) there is a trend to lower values & long strings of negative values; (3) there are weak rankings; and (4) there is a weakening in the outlook relative to the current situation. Fortunately, actual U.K. retail sales volumes themselves have not yet shown this degree of weakness. But the future indexes on expectations in this CBI survey are caving in and much of that is recent. And Brexit is coming. There are more shocks in store and there will be weakness ahead.

Robert Brusca
AuthorMore in Author Profile »Robert A. Brusca is Chief Economist of Fact and Opinion Economics, a consulting firm he founded in Manhattan. He has been an economist on Wall Street for over 25 years. He has visited central banking and large institutional clients in over 30 countries in his career as an economist. Mr. Brusca was a Divisional Research Chief at the Federal Reserve Bank of NY (Chief of the International Financial markets Division), a Fed Watcher at Irving Trust and Chief Economist at Nikko Securities International. He is widely quoted and appears in various media. Mr. Brusca holds an MA and Ph.D. in economics from Michigan State University and a BA in Economics from the University of Michigan. His research pursues his strong interests in non aligned policy economics as well as international economics. FAO Economics’ research targets investors to assist them in making better investment decisions in stocks, bonds and in a variety of international assets. The company does not manage money and has no conflicts in giving economic advice.
More Economy in Brief


