 Global| Apr 27 2010
Case-Shiller Home PriceIndexContinues Sideways Movement
by:Tom Moeller
|in:Economy in Brief
Summary
Earlier improvement in home prices continued to weaken during February. Seasonally adjusted, the Case-Shiller Home Price Index slipped 0.1% and continued its sideways pattern since September. Nevertheless, the 0.7% increase versus [...]

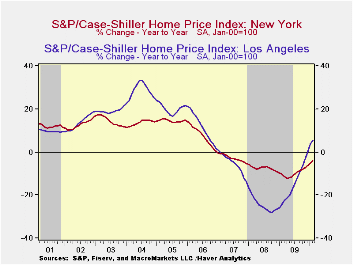
Earlier improvement in home prices continued to weaken during February. Seasonally adjusted, the Case-Shiller Home Price Index slipped 0.1% and continued its sideways pattern since September. Nevertheless, the 0.7% increase versus last February compares to a 19.0% y/y rate of decline at its worst, roughly one year ago.
The narrower 10 City Composite Index rose a seasonally adjusted 0.1% (1.5% y/y). Over the last year, prices rose 1.5% versus a 19.4% decline at its worst.
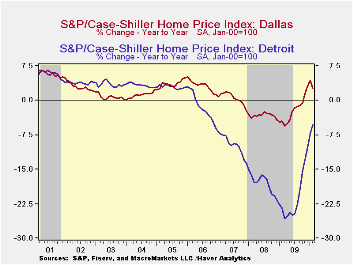
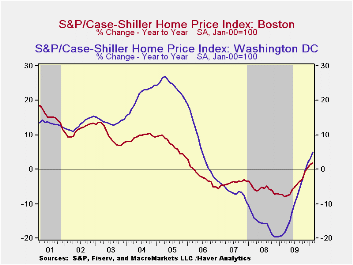
The performance of home prices continues to vary around the country. During February, the 12-month gain in prices was strongest in the West. Prices in Washington D.C. and Dallas rose moderately but widespread declines were logged elsewhere.
The Case-Shiller home price series are value-weighted, i.e., a greater index weight is assigned to more expensive homes. The S&P/Case-Shiller home price series can be found in Haver's USECON database and the city data highlighted below is in the REGIONAL database.
Achieving Fiscal Sustainability is the title of this morning's speech by Fed Chairman Ben S. Bernanke and it can be found here.
| S&P/Case-Shiller Home Price Index (SA) | February m/m | January m/m | December m/m | Feb. y/y | 2009 | 2008 | 2007 |
|---|---|---|---|---|---|---|---|
| 20 City Composite Index | -0.1 | 0.3 | 0.3 | 0.7 | -13.3 | -15.7 | -3.8 |
| Regional Indicators | |||||||
| Atlanta | -0.9 | -0.5 | 0.0 | -0.9 | -11.6 | -8.5 | 0.7 |
| Boston | -0.5 | 0.3 | 0.7 | 1.8 | -4.9 | -5.7 | -4.0 |
| Chicago | -1.0 | -0.8 | -0.7 | -2.9 | -14.2 | -10.0 | -1.0 |
| Dallas | -1.4 | -0.2 | 0.1 | 2.7 | -2.3 | -3.3 | 0.5 |
| Denver | -0.2 | -0.1 | -0.0 | 3.7 | -2.8 | -4.9 | -1.7 |
| Los Angeles | 0.2 | 1.9 | 1.2 | 5.4 | -15.4 | -24.2 | -5.2 |
| New York | -0.2 | -0.2 | -0.4 | -4.1 | -9.8 | -7.4 | -2.8 |
| San Francisco | 0.4 | 0.5 | 0.8 | 12.0 | -18.4 | -24.3 | -4.5 |
by Tom Moeller April 27, 2010
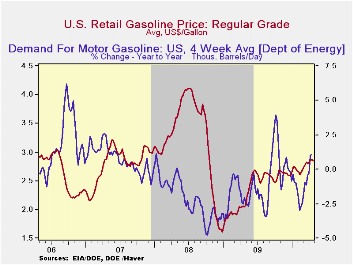

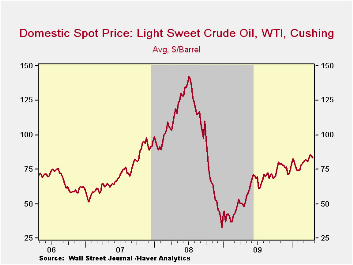
April has been a firm month for energy prices and a gallon of regular gasoline averaged its highest price since October 2008. Last week, it remained near the prior week's high of $2.85 which was up by 77% since the December, 2008 low. Yesterday, the spot market price for a gallon of regular gasoline held onto its level late last week. The figures are reported by the U.S. Department of Energy and can be found in Haver's WEEKLY & DAILY databases.
Crude oil costs slipped last week but an upward trend has been behind the rise in gasoline prices. The price for a barrel of light sweet crude (WTI) again fell slightly last week to $83.04 but for the month averaged $84.22 versus $81.01 during March. Prices remain up by two-and-one half times the 2008 low.
A firming of demand has helped energy prices move higher. Weekly gasoline usage was up 1.1% last week versus one year ago and that compares with a 3.0% decline in early-February. The demand for residual fuel oil jumped 10.5% but distillate demand fell 4.1% y/y. Inventories of crude oil and petroleum products rose slightly last month but were down slightly from one year ago. That contrasts with a strong inventory accumulation into September of last year.
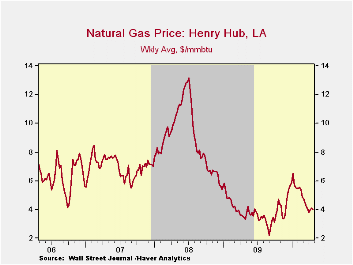
U.S. natural gas prices were steady last week at $4.00 per mmbtu (+15.8% y/y). Prices reached a high of $6.50 early in January. Nevertheless, prices remained nearly double the September low.
The energy price data can be found in Haver's WEEKLY database while the daily figures are in DAILY. The gasoline demand figures are in OILWKLY.
| Weekly Prices | 04/26/10 | 04/19/10 | 04/12/10 | Y/Y | 2009 | 2008 | 2007 |
|---|---|---|---|---|---|---|---|
| Retail Regular Gasoline ($ per Gallon, Regular) | 2.85 | 2.86 | 2.86 | 39.0% | 2.35 | 3.25 | 2.80 |
| Light Sweet Crude Oil, WTI ($ per bbl.) | 83.04 | 84.60 | 85.97 | 73.6% | 61.39 | 100.16 | 72.25 |
by Tom Moeller April 27, 2010
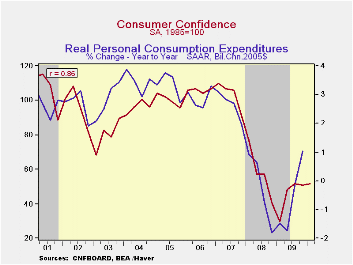
Improvement in consumers' mood continued this month according to the Conference Board. Their consumer confidence index rose 10.7% m/m to 57.9, its highest level since September 2008. The gain handily outpaced the Consensus expectation for a rise to 53.5. During the last ten years there has been an 86% correlation between the level of consumer confidence and the y/y change in real consumer spending. The Conference Board data can be found in Haver's CBDB database.
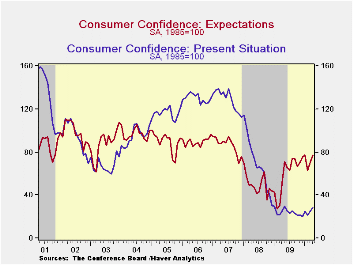
Consumers' assessment of the present situation jumped 13.5% m/m after a similar March rise, off a near-record low. Jobs were seen as hard to get by a reduced 45.0% of respondents but jobs were seen as plentiful by only 4.8%. That was up just slightly from the series' historic low reached in November. Also improved was the percentage of respondents who saw business conditions as good. The percentage of consumers who thought business conditions were bad fell to 40.2%, off ten points from its peak during the recession.
The expectations component of confidence also improved m/m to its highest level just before the recession. Improved expectations for employment led the gain but expectations for business conditions and income rose just slightly. Expectations for the inflation rate in twelve months slipped to 5.3% and that remained down from last year's high of 7.7%. Interest rates in twelve months were expected to be higher by an increased 56.3%, the highest since 2007. A much-reduced 12.2% expected rates to fall. An increased 35.0% of respondents expected stock prices to rise. That was near the recent high.
A reduced 2.0% of those surveyed plan to buy a home during the next six months. An improved 27.4% plan to buy a major appliance, though 30.9% planned to buy one back in 2007. An improved 5.1% plan to buy an automobile versus 6.0% in 2007 and a greater 2.3% plan to buy a new one, just off the series' historic low.

| Conference Board (SA, 1985=100) | April | March | February | Y/Y % | 2009 | 2008 | 2007 |
|---|---|---|---|---|---|---|---|
| Consumer Confidence Index | 57.9 | 52.3 | 46.4 | 41.9 | 45.2 | 57.9 | 103.4 |
| Present Situation | 28.6 | 25.2 | 21.7 | 12.2 | 24.0 | 69.9 | 128.8 |
| Expectations | 77.4 | 70.4 | 62.9 | 51.8 | 59.3 | 50.0 | 86.4 |
by Louise Curley April 27, 2010
 France,
Germany, Italy and Switzerland released indicators of consumer
confidence today. The latest data for the Swiss indicator,
the UBS Consumption Indicator, are for March. Those for
Italy, ISAE's consumer survey, and France, INSEE's household survey,
are for April and those for Germany, GfK's consumer climate survey,
May.
France,
Germany, Italy and Switzerland released indicators of consumer
confidence today. The latest data for the Swiss indicator,
the UBS Consumption Indicator, are for March. Those for
Italy, ISAE's consumer survey, and France, INSEE's household survey,
are for April and those for Germany, GfK's consumer climate survey,
May.
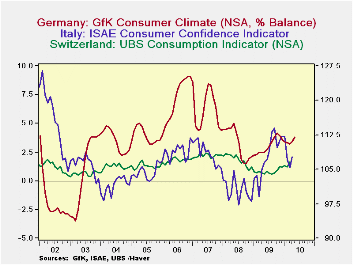
After some loss of confidence at the end of last year and
early
this year, due largely to the rise in energy prices, consumer
confidence in Switzerland, Italy and Germany has recovered as can be
seen in the first chart. French consumers, however, have on
balance become more negative, as shown in the second chart.
It should be noted that since its inception in April, 1986, that the
 only
time the non seasonally adjusted French measure of consumer
confidence has reported a positive balance of opinion was during the
period from July 1999 to May 2001, as seen in the second
chart. The average balance of opinion over the whole span is
-18.
only
time the non seasonally adjusted French measure of consumer
confidence has reported a positive balance of opinion was during the
period from July 1999 to May 2001, as seen in the second
chart. The average balance of opinion over the whole span is
-18.
The measures of consumer confidence vary from country to country. Balances of opinion in German and France, an index with a base year of 1980 for Italy and a so-called index for Switzerland. The Swiss indicator has no base year and is an index in the sense that "it points to, identifies or highlights a particular trend or condition" (Definition of index, no.3 in Chambers 21st Century Dictionary). One way to judge current values is to relate them to the average of the data over its history, which is shown in the last column of the following table. Consumer confident in Germany at 3.8 in May is above its long term average of 3.3, as is Swiss consumer confidence, which in March was 1.708 compared with its long term average of 1.501. In April, French consumer confidence at -37 was well below its long term average of -18 while Italian consumer confidence of 107.7 was moderately below its long term average of 112.7 (1980=100).
| May 10 | Apr 10 | Mar 10 | Feb 10 | Jan 10 | Dec 09 | Nov 09 | Average* | |
|---|---|---|---|---|---|---|---|---|
| Germany: GFK Consumer Climate % Bal | 3.8 | 3.4 | 3.2 | 3.3 | 3.4 | 3.6 | 3.9 | 3.3 |
| France: INSEE Household Survey | -- | -37 | -35 | -34 | -29 | -33 | -32 | -18 |
| Italy: ISAE Consumer Survey1980=100 | -- | 107.7 | 105.3 | 107.2 | 112.1 | 111.2 | 111.2 | 112.7 |
| Switzerland: UBS Consumption Indicator | -- | -- | 1.708 | 1.201 | 1.322 | 1.201 | 1.279 | 1.501 |
| *Average over the span of available data | ||||||||

Tom Moeller
AuthorMore in Author Profile »Prior to joining Haver Analytics in 2000, Mr. Moeller worked as the Economist at Chancellor Capital Management from 1985 to 1999. There, he developed comprehensive economic forecasts and interpreted economic data for equity and fixed income portfolio managers. Also at Chancellor, Mr. Moeller worked as an equity analyst and was responsible for researching and rating companies in the economically sensitive automobile and housing industries for investment in Chancellor’s equity portfolio. Prior to joining Chancellor, Mr. Moeller was an Economist at Citibank from 1979 to 1984. He also analyzed pricing behavior in the metals industry for the Council on Wage and Price Stability in Washington, D.C. In 1999, Mr. Moeller received the award for most accurate forecast from the Forecasters' Club of New York. From 1990 to 1992 he was President of the New York Association for Business Economists. Mr. Moeller earned an M.B.A. in Finance from Fordham University, where he graduated in 1987. He holds a Bachelor of Arts in Economics from George Washington University.
More Economy in Brief


