 Global| May 25 2010
Case-Shiller Home Price Index Improves Y/Y But Momentum Eases
by:Tom Moeller
|in:Economy in Brief
Summary
The recent improvement in home sales has not enhanced pricing power by much, but at least it's ended earlier declines. Seasonally adjusted, the Case-Shiller Home Price Index slipped just marginally from February. That capped a 3.7% [...]
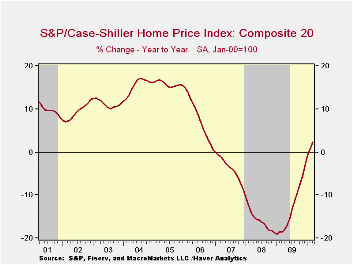
The recent improvement in home sales has not enhanced pricing power by much, but at least it's ended earlier declines. Seasonally adjusted, the Case-Shiller Home Price Index slipped just marginally from February. That capped a 3.7% rise in prices since last May's low following double-digit, y/y price declines dating back to early-2008. Overall, home prices have fallen 29.8% since the April 2006 peak.
The narrower 10 City Composite Index rose a seasonally adjusted 0.2%. Over the last year prices rose 1.5% and they're up 4.6% since the low during May of last year.
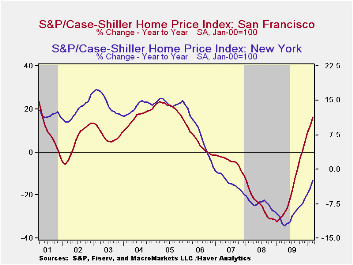
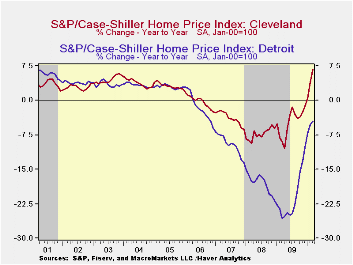
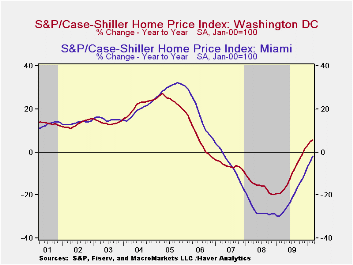
The performance of home prices continued to vary around the country. During March the 12-month gain in prices was strongest in the West where in San Francisco they rose 16.3% and in San Diego by 10.8%. Lesser price gains were logged in Los Angeles (6.1%) and Denver (4.1%). Prices also rose in Cleveland (6.7%) Minneapolis (6.6%), Washington D.C. (5.7%), Boston (3.9%), Dallas (3.1%) and Phoenix (2.5%). Widespread, though lessened, price declines continued in Detroit (-4.5%), Charlotte (-3.9%), Seattle (-3.5%), Portland (-2.7%), New York (-2.4%) and Atlanta (-1.2%).
The Case-Shiller home price series are value-weighted, i.e., a greater index weight is assigned to more expensive homes. The S&P/Case-Shiller home price series can be found in Haver's USECON database and the city data highlighted below is in the REGIONAL database.
| S&P/Case-Shiller Home Price Index (SA) | March m/m | February m/m | January m/m | March y/y | 2009 | 2008 | 2007 |
|---|---|---|---|---|---|---|---|
| 20 City Composite Index | -0.0 | -0.1 | 0.3 | 2.4 | -13.3 | -15.7 | -3.8 |
| Regional Indicators | |||||||
| Atlanta | -1.3 | -0.7 | -0.6 | -1.2 | -11.6 | -8.5 | 0.7 |
| Boston | 0.3 | -0.4 | 0.3 | 3.9 | -4.9 | -5.7 | -4.0 |
| Chicago | -2.0 | -1.1 | -0.5 | -2.2 | -14.2 | -10.0 | -1.0 |
| Dallas | 0.3 | -1.3 | -0.3 | 3.1 | -2.3 | -3.3 | 0.5 |
| Denver | 0.5 | -0.0 | -0.1 | 4.1 | -2.8 | -4.9 | -1.7 |
| Los Angeles | -0.3 | 0.1 | 1.9 | 6.1 | -15.4 | -24.2 | -5.2 |
| New York | -0.1 | -0.1 | -0.2 | -2.4 | -9.8 | -7.4 | -2.8 |
| San Francisco | 0.9 | 0.4 | 0.6 | 16.3 | -18.4 | -24.3 | -4.5 |
| Tampa | -0.0 | -0.3 | 0.3 | -3.5 | -18.8 | -19.2 | -7.6 |

Tom Moeller
AuthorMore in Author Profile »Prior to joining Haver Analytics in 2000, Mr. Moeller worked as the Economist at Chancellor Capital Management from 1985 to 1999. There, he developed comprehensive economic forecasts and interpreted economic data for equity and fixed income portfolio managers. Also at Chancellor, Mr. Moeller worked as an equity analyst and was responsible for researching and rating companies in the economically sensitive automobile and housing industries for investment in Chancellor’s equity portfolio. Prior to joining Chancellor, Mr. Moeller was an Economist at Citibank from 1979 to 1984. He also analyzed pricing behavior in the metals industry for the Council on Wage and Price Stability in Washington, D.C. In 1999, Mr. Moeller received the award for most accurate forecast from the Forecasters' Club of New York. From 1990 to 1992 he was President of the New York Association for Business Economists. Mr. Moeller earned an M.B.A. in Finance from Fordham University, where he graduated in 1987. He holds a Bachelor of Arts in Economics from George Washington University.
More Economy in Brief


