 Global| Mar 30 2010
Case-Shiller Home Price Index HitsA Brick Wall?
by:Tom Moeller
|in:Economy in Brief
Summary
News-wire headlines indicate that the rebound in home prices has stalled. Seasonally adjusted, the Case Shiller Home Price Index fell during January by 0.4% for the fourth consecutive month. This, however, overstates the weakness [...]
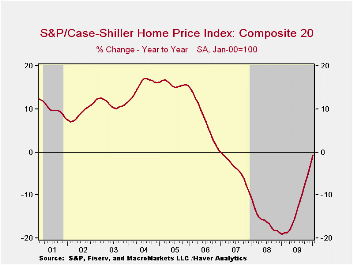
News-wire headlines indicate that the rebound in home prices has stalled. Seasonally adjusted, the Case Shiller Home Price Index fell during January by 0.4% for the fourth consecutive month. This, however, overstates the weakness since seasonally adjusted prices have been rising slightly since last June. Regardless, the y/y trend paints a different picture of improvement. The 0.7% decline versus last January compares to a 19.0% y/y rate of decline at its worst one year ago. That's not a barn-burning improvement, however, and it may not go much further unless home sales improve.
The narrower 10 City Composite Index rose a seasonally adjusted 0.4% (-0.0% y/y) for the second month. The 12-month decline also eased from -19.4% at its worst. By far, these negative comparisons outpace those during the 1990-91 recession when home prices fell 6.3%.
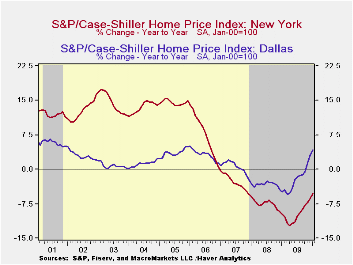
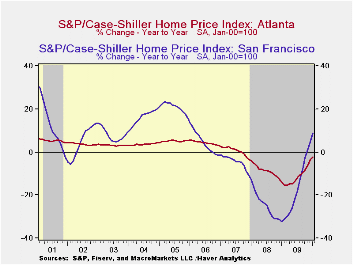
The performance of home prices continues to vary around the country. During January, yearly price gains improved in twelve cities including Boston, San Diego, Los Angeles, San Francisco, Denver, Dallas and Washington D.C. They continued down in seven cities including Atlanta, Chicago, Miami, Detroit and Seattle.
The Case Shiller home price series are value-weighted, i.e., a greater index weight is assigned to more expensive homes. The S&P/Case-Shiller home price series can be found in Haver's USECON database and the city data highlighted below is in the REGIONAL database.
Responding to the foreclosure crisis—A conference summary from the Federal Reserve Bank of Chicago is available here.
| S&P/Case-Shiller Home Price Index (SA, Jan 00 = 100) | January m/m | December m/m | November m/m | Jan. y/y | 2009 | 2008 | 2007 |
|---|---|---|---|---|---|---|---|
| 20 City Composite Index | 0.3 | 0.3% | 0.3% | -0.7% | -13.3% | -15.7% | -3.8% |
| Regional Indicators | |||||||
| Atlanta | -0.5 | 0.0 | 0.1 | -2.1 | -11.6 | -8.5 | 0.7 |
| Boston | 0.3 | 0.7 | 0.6 | 1.5 | -4.9 | -5.7 | -4.0 |
| Chicago | -0.8 | -0.7 | -0.7 | -4.3 | -14.2 | -10.0 | -1.0 |
| Dallas | -0.3 | 0.2 | 0.9 | 4.2 | -2.3 | -3.2 | 0.5 |
| Denver | 0.1 | -0.0 | 0.3 | 2.8 | -2.8 | -4.9 | -1.7 |
| Los Angeles | 1.8 | 1.2 | 1.4 | 3.8 | -15.4 | -24.2 | -5.2 |
| New York | -0.3 | -0.4 | -0.9 | -5.4 | -9.8 | -7.4 | -2.8 |
| San Francisco | 0.6 | 0.8 | 1.2 | 9.1 | -18.4 | -24.3 | -4.5 |
by Tom Moeller
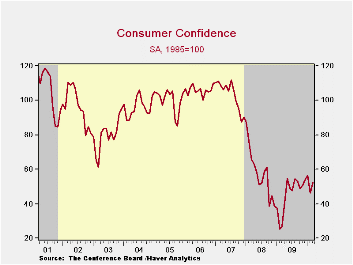
Consumers' mood looks to be on the mend. For March the Conference Board reported that its consumer confidence index reversed much of the prior month's slide with a 13.1% increase to 52.5. The latest figure was in the middle of the range that's been in place last spring and the rebound outpaced the Consensus expectation for a rise to 50.0. During the last ten years there has been an 83% correlation between the level of consumer confidence and the y/y change in real consumer spending. The Conference Board data can be found in Haver's CBDB database.
Consumers' assessment of the present situation recovered all of the prior month's decline but remained near the historic low. Jobs were seen as hard to get by a diminished 45.8% of respondents but jobs were seen as plentiful by only 4.4%. That was up just slightly from the series' historic low reached in November. Also improved was the percentage of respondents who saw business conditions as good. The percentage of consumers who thought business conditions were bad fell to 42.8%, off nearly ten points from its peak one year ago.
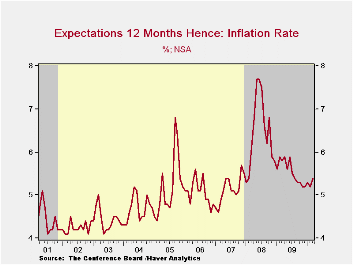
The expectations component of confidence also improved m/m after the sharp February decline. Modestly improved expectations for business conditions, employment and income led the gain. Expectations for the inflation rate in twelve months also increased to 5.4% but that remained down from last year's high of 7.7%. Interest rates in twelve months were expected to be higher by an increased 53.9%, the highest since 2007 while 12.9% expected rates to fall. An increased 33.2% of respondents expected stock prices to rise and that was near the middle of the range since last spring.
An improved 2.8% of those surveyed plan to buy a home during the next six months. A diminished 25.8% plan to buy a major appliance versus 30.9% back in 2007. Only 3.8% plan to buy an automobile versus 6.0% in 2007 and just 1.4% plan to buy a new one. That was near the series' historic low.
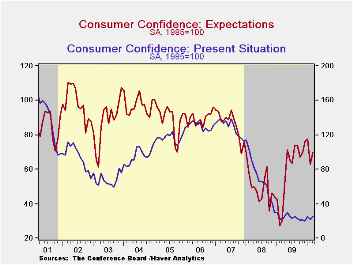
| Conference Board (SA, 1985=100) | March | February | January | Y/Y % | 2009 | 2008 | 2007 |
|---|---|---|---|---|---|---|---|
| Consumer Confidence Index | 52.5 | 46.4 | 56.5 | 95.2 | 45.2 | 57.9 | 103.4 |
| Present Situation | 26.0 | 21.7 | 25.2 | 18.7 | 24.0 | 69.9 | 128.8 |
| Expectations | 70.2 | 62.9 | 77.3 | 132.5 | 59.3 | 50.0 | 86.4 |
by Tom Moeller
It's back and forth. Last week the pump price for regular gasoline retraced two of its three cent gain during the prior week to settle at $2.80 per gallon. Nevertheless the price remained up by three-quarters since December of 2008. Yesterday, the spot market price for a gallon of regular gasoline jumped five cents from Friday but was down slightly from last week's average. The figures are reported by the U.S. Department of Energy and can be found in Haver's WEEKLY & DAILY databases.
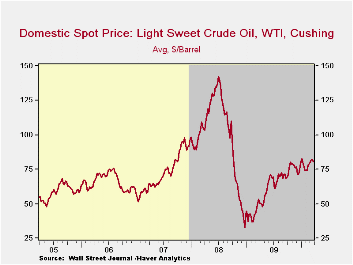
The price for a barrel of light sweet crude (WTI) eased further last week to $80.46. Nevertheless, the average for the month of $81.01 was its highest since the summer of 2008. Prices that have risen from $71.53 early this past December are more than double the December 2008 low of $32.37. Yesterday, the spot price rose further to $82.17.
Demand for gasoline fell 1.2% last week versus one year ago. That decline compared to a 3.9% increase at the beginning of October. The demand for residual fuel oil rose a lessened 8.4% but distillate demand fell 1.0% y/y. Inventories of crude oil and petroleum products slipped again in early-March and were down slightly from one year ago.
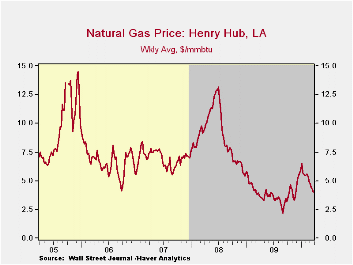
U.S. natural gas prices continued to slide last week to an average $4.03 per mmbtu (+2.6% y/y). Prices reached a high of $6.50 early in January. Nevertheless, prices remained nearly double the September low.
The energy price data can be found in Haver's WEEKLY database while the daily figures are in DAILY. The gasoline demand figures are in OILWKLY.
| Weekly Prices | 3/29/10 | 3/22/10 | 03/15/10 | Y/Y | 2009 | 2008 | 2007 |
|---|---|---|---|---|---|---|---|
| Retail Regular Gasoline ($ per Gallon, Regular) | 2.80 | 2.82 | 2.79 | 36.8% | 2.35 | 3.25 | 2.80 |
| Light Sweet Crude Oil, WTI ($ per bbl.) | 80.64 | 81.46 | 81.76 | 51.9% | 61.39 | 100.16 | 72.25 |
by Robert Brusca March 30, 2010
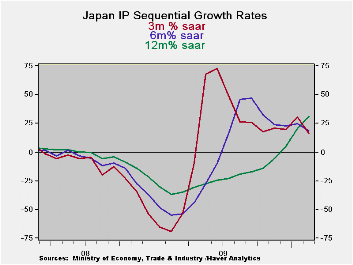
Despite the month’s sharp drop in output, the chart of Japan’s sequential growth rates is a very encouraging picture of an economy in transition. Still it offers no iron-clad promise for the future. The chart shows the drop of IP into recession. Of course the various lines on the chart drop sequentially with the shortest growth rate going down first (3-Mo) then the six-month rate and finally the Yr/Yr rate. Of course the shortest period growth rate makes the largest swings as well and we see that carried into recovery, there is a nice symmetry between the lows and thighs of the 3-month and six mo growth rates. The Yr/Yr rate is still rising.
After the clear recession gyration to new growth rate lows and new growth rate highs, the various growth rate series have settled down to a steady growth path at 25%- still too strong to be sustainable. In the current month we see that path ratcheting a bit lower. Still the six- and three-month growth rates are fairly steady and the Yr/Yr pace is still rising.
As I said at the start there is nothing in this a pattern that assures a soft landing ahead. But the behavior in the indices is just what you would want and expect from a sold recovery that develops after a downturn. Japan still needs to slow its year-over-year advance to something that is more sustainable. And, beyond the numbers, Japan needs to spread the recovery beyond its export sector.
The table shows us that for all the gyrations in IP overall IP is still just 82.9% of its cycle peak. Its transportation output is about 25% below its cycle peak. Investment goods lag the most at only 73.7% of their cycle peak while electric and gas output is closest to full recovery at nearly 95% of its peak level of output in this cycle.
In the current quarter, despite the sharp drop in output in February, IP is still growing in excess of 20 percent annual rates for the headline series. Consumer goods, textiles and mining are the weak sectors in the unfolding quarter-to-date. Auto output has been strong but we may see a shift there due to the problems at Toyota. Still Japan is putting up a very good profile despite the drop in IP in February.
| Japan Industrial Production Trends | |||||||||
|---|---|---|---|---|---|---|---|---|---|
| m/m % | Saar % | Yr/Yr | Qtr-2-Date % AR |
%of
Cycle Peak |
|||||
| Seas Adjusted | Feb-10 | Jan-10 | Dec-09 | 3-mo | 6-mo | 12-mo | Yr-Ago | ||
| Mining & MFG | -0.9% | 2.7% | 1.9% | 15.9% | 18.4% | 31.4% | -36.9% | 22.3% | 82.9% |
| Total Industry | -1.1% | 3.1% | 1.7% | 15.8% | 18.0% | 29.8% | -35.7% | 23.2% | 83.5% |
| MFG | -0.9% | 2.6% | 1.9% | 15.4% | 18.2% | 31.2% | -36.9% | 21.7% | 82.8% |
| Textiles | -4.1% | 1.9% | -0.9% | -11.9% | -1.5% | -4.9% | -20.8% | -4.2% | 70.6% |
| T-port | -2.0% | 5.9% | -2.9% | 3.0% | 41.3% | 91.0% | -60.0% | 26.9% | 76.2% |
| Product Group | |||||||||
| Consumer Gds | -2.7% | 2.7% | -0.7% | -3.3% | 2.6% | 22.9% | -30.5% | 6.6% | 85.3% |
| Intermediate Gds | -0.7% | 3.2% | 1.3% | 16.2% | 20.3% | 46.3% | -41.9% | 24.0% | 84.5% |
| Investment Gds | 2.0% | 2.3% | 1.2% | 24.2% | 30.9% | 11.8% | -32.5% | 28.8% | 73.7% |
| Mining | 1.5% | 1.3% | 2.6% | 23.7% | -3.1% | -1.6% | -6.5% | 9.5% | 87.3% |
| Electric&Gas | 0.9% | 1.6% | 0.5% | 12.4% | 21.6% | 8.1% | -12.2% | 16.3% | 94.9% |
by Louise Curley March 30, 2010
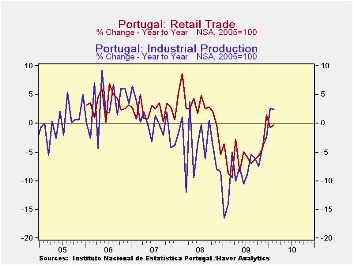
Portugal, one of those problem countries in the Euro Area along with Ireland, Spain and Greece is beginning to show some slight signs of an improving economy . The first chart shows the year to year increases in Retail Trade and in Industrial Production. According to data announced today, the year to year increase in industrial production was 2.4% in February, compared with 2.6% in January. These were the first positive year to year changes since September 2008. Retail trade experienced its first positive year to year change since October, 2008, in December of last year. Although negative, the year to year changes since then have been small, -0.73% in January and -0.43% in February.
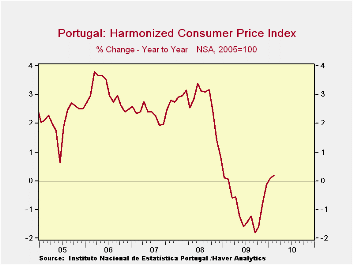
Another indication that the economy is beginning to recover is the rise, though modest, in prices. The year to year increase in the Harmonized Consumer Price Index turned positive for the first time since February 09 in January of this year and has continued to rise in February, as can be seen in the second chart.
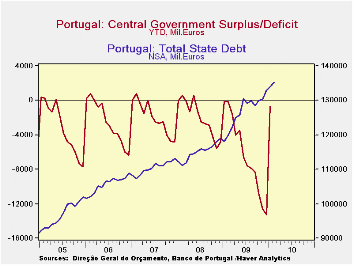
While these signs are encouraging, much remains to be done to redress Portugal's growing government deficit and debt, which are illustrated in the third chart.
| Feb 10 | Jan 10 | Dec 09 | Previous Positive | Date | |
|---|---|---|---|---|---|
| Industrial Production | 2.42 | 2.56 | -2.40 | 0.58 | Sep 08 |
| Value of Retail Trade (Y/Y% | 0.34 | 0.73 | 1.77 | 2.06 | Oct 08 |
| Harmonized Consumer Price Index (Y/Y%) | 0.18 | 0.09 | -0.14 | -0.07 | Feb 09 |

Tom Moeller
AuthorMore in Author Profile »Prior to joining Haver Analytics in 2000, Mr. Moeller worked as the Economist at Chancellor Capital Management from 1985 to 1999. There, he developed comprehensive economic forecasts and interpreted economic data for equity and fixed income portfolio managers. Also at Chancellor, Mr. Moeller worked as an equity analyst and was responsible for researching and rating companies in the economically sensitive automobile and housing industries for investment in Chancellor’s equity portfolio. Prior to joining Chancellor, Mr. Moeller was an Economist at Citibank from 1979 to 1984. He also analyzed pricing behavior in the metals industry for the Council on Wage and Price Stability in Washington, D.C. In 1999, Mr. Moeller received the award for most accurate forecast from the Forecasters' Club of New York. From 1990 to 1992 he was President of the New York Association for Business Economists. Mr. Moeller earned an M.B.A. in Finance from Fordham University, where he graduated in 1987. He holds a Bachelor of Arts in Economics from George Washington University.
More Economy in Brief


