Global| Feb 24 2009
Case-Shiller Home Price Index FellA Record 18.5% Last Year
by:Tom Moeller
|in:Economy in Brief
Summary
The S&P/Case-Shiller 20 Home Price Composite Index fell 2.0% during December, the third such decline in three months. That pulled prices down 18.5% during the last twelve months and by 26.7% since their peak in May 2006. The series [...]
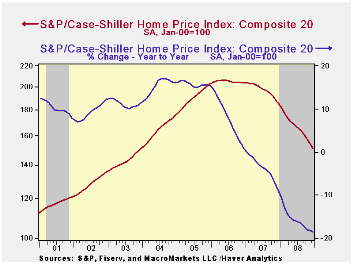
The S&P/Case-Shiller 20 Home Price Composite Index fell 2.0% during December, the third such decline in three months. That pulled prices down 18.5% during the last twelve months and by 26.7% since their peak in May 2006. The series dates back only to 2000. The December decline in prices was expected.
The S&P/Case-Shiller home price series can be found in Haver's USECON database but the city data is in the REGIONAL database.
The Case-Shiller index of 20 U.S. cities and their surrounding areas is weighted to reflect price changes due to extensive remodeling, home additions or extreme neglect. For example, smaller weights are assigned to sales of homes that have undergone extensive remodeling.
The Case-Shiller composite index of homes in 10 metropolitan areas, which has a longer history and dates back to 1987, fell 1.8% during December and was down 19.2% year-to-year. The measure was down 28.2% since the 2006 peak.
Weakest Regions: Home prices in Phoenix,
Nevada were quite weak last year and fell 34.0% y/y and in San Diego
prices fell 24.8% y/y, off 39.1% from their early 2006 peak. Home
prices in Las Vegas, Nevada fell 39.1% y/y and were down 44.1% from
their peak. Prices in Miami fell 28.8% y/y last year while home prices
in Los Angeles were down 26.4% y/y. In San Francisco home prices were
off 31.2% year-to-year. In Tampa they fell 22.0% last year and in
Detroit home prices fell by 21.7% y/y.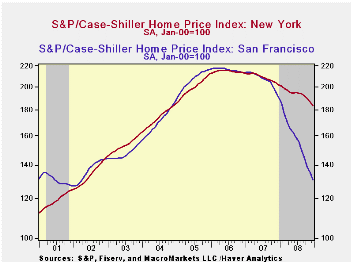
Less Weak Regions: In the Northeast, the decline in home prices continued less severe. In New York, prices fell 9.2% last year, off 15.2% from their 2006 peak. Prices were down 7.0% year-to-year in Boston. In Dallas prices also were off by a modest 4.2% y/y and by 7.1% from last year's peak. In Charlotte, North Carolina they fell a moderate 7.1% y/y and in Denver home prices were off 4.0% y/y. In Cleveland, Ohio prices were off 6.1% y/y but in Chicago home prices were down a larger 14.3% y/y, 18.5% from the 2007 peak.
The latest press release from Standard & Poor's can be found here.
An overview of the S&P/Case-Shiller home price series can be found here.
Chairman Ben S. Bernanke's Semiannual Monetary Policy Report to the Congress is available here.
| S&P/Case-Shiller Home Price Index (NSA, Jan 00 = 100) | December | November | Y/Y | 2008 | 2007 | 2006 |
|---|---|---|---|---|---|---|
| 20 City Composite Index | 150.99 | 154.04 | -18.5% | -15.7% | -3.8% | 7.6% |
U.S. Gasoline Prices Dipped
by Tom Moeller February 24, 2009
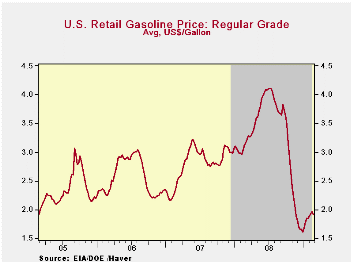
According to the U.S. Department of Energy, regular gasoline prices last week dipped five cents from the earlier period. Nevertheless, at an average $1.91 per gallon prices remained near their recent high, up 30 cents from the low. Yesterday, the recent downturn continued. The spot market price for regular gasoline was $1.06 per gallon, down from the high of two weeks ago of $1.32 per gallon.
Weekly gasoline prices can be found in Haver's WEEKLY
database. Daily prices are in the DAILY
database.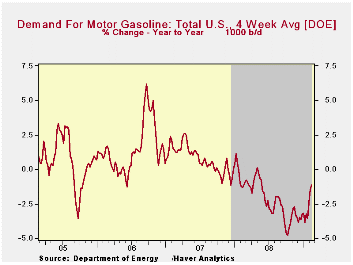
Gasoline demand continued down last week in reaction to the economy's weakness, the U.S. Department of Energy reported. But the year-to-year shortfall eased further to -1.2% from its worst comparison of -4.8% last October (the latest four weeks versus the same four weeks in 2008). Demand for all petroleum products was unchanged y/y after the -8.0% comparison last October. These numbers are available in Haver's OILWKLY database.
The price for a barrel of West Texas Intermediate crude fell back last week to $40.50 per barrel from the average $41.72 during January. Prices reached a high of $145.66 last July. In futures trading yesterday, the one-month price for crude oil was $38.44 per barrel. Last week's average was $36.99.
The price of natural gas fell further last week to $4.32 per mmbtu (-51.3% y/y). The latest average price was down two-thirds from the high reached in early-July of $13.19/mmbtu.
| Weekly Prices | 02/23/09 | 02/16/09 | Y/Y | 2008 | 2007 | 2006 |
|---|---|---|---|---|---|---|
| Retail Regular Gasoline ($ per Gallon) | 1.91 | 1.96 | -39.0% | 3.25 | 2.80 | 2.57 |
| Light Sweet Crude Oil, WTI ($ per bbl.) | 36.99 | 36.91 | -62.8% | 100.16 | 72.25 | 66.12 |
U.S. Chain Store Sales Up Again Last Week
by Tom Moeller February 24 2009
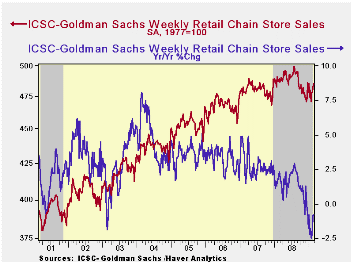
The consumer may be getting back on his feet. Chain store sales rose 0.6% last week (Feb.21) after the prior week's 0.9% increase, according to the International Council of Shopping Centers-Goldman Sachs Index. The latest increases lifted sales so far this month by 0.9% above the January average which had risen slightly from December.
The chain store sales figures are available in Haver's SURVEYW database.
During the last ten years there has been a 64% correlation between the year-to-year growth in chain store sales and the growth in general merchandise sales.
The ICSC-Goldman Sachs retail chain-store sales index is constructed using the same-store sales (stores open for one year) reported by 78 stores of seven retailers: Dayton Hudson, Federated, Kmart, May, J.C. Penney, Sears and Wal-Mart.
The outlook for sales, however, remains far from robust. The weekly leading indicator of chain store sales from ICSC-Goldman Sachs ticked up just slightly last week and so far this month is down 2.3% from January (-3.4% y/y).
| ICSC-UBS (SA, 1977=100) | 02/21/09 | 02/14/09 | Y/Y | 2008 | 2007 | 2006 |
|---|---|---|---|---|---|---|
| Total Weekly Chain Store Sales | 485.9 | 482.8 | -0.8% | 1.4% | 2.8% | 3.3% |
U.S. Consumer Confidence Fell To A Record Low
by Tom Moeller February 24, 2009
 The
Conference Board reported that its February index of consumer
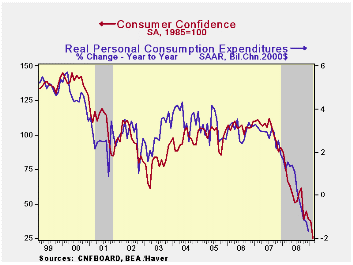
confidence fell to another record low. The decline to a
reading of 25.0 was a one-third drop versus January and it lowered
confidence by three-quarters from the July 2007 peak. The
February decline was much deeper than Consensus expectations.
The
Conference Board reported that its February index of consumer
confidence fell to another record low. The decline to a
reading of 25.0 was a one-third drop versus January and it lowered
confidence by three-quarters from the July 2007 peak. The
February decline was much deeper than Consensus expectations.
The Conference Board data can be found in Haver's CBDB database.
During the last ten years there has been an 83% correlation between the level of consumer confidence and the y/y change in real consumer spending.
The present conditions index fell 28.6% from the
January level and it was off more than three-quarters from a year
earlier.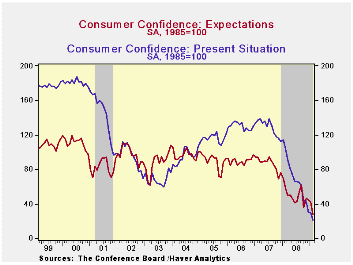 Jobs were seen as hard to get by 47.8% of
respondents, the highest since 1992 and jobs were seen as plentiful by
only 4.4%. Business conditions were seen as good by just 6.8%
and that matched the 1991 low. Those who thought conditions
were bad rose to 51.1%, the highest since 1983.
Jobs were seen as hard to get by 47.8% of
respondents, the highest since 1992 and jobs were seen as plentiful by
only 4.4%. Business conditions were seen as good by just 6.8%
and that matched the 1991 low. Those who thought conditions
were bad rose to 51.1%, the highest since 1983.
Consumers' economic outlook continued to worsen as indicated by yet another decline in the expectations index. The figure fell by more than one-third from January and by more than one-half from last February. The percentage of respondents expecting business conditions to worsen in six months rose to 40.5%, the highest since 1974. Just 8.7% expected improvement in conditions. More jobs were expected by only 7.1% of respondents while a near-record 23.8% foresaw less income.
Expectations for the inflation rate in
twelve months have been roughly stable at the February level of
5.9%. That's down from last year's high of 7.7%.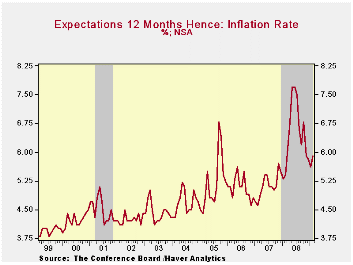 Confusion about the interest rate outlook was evident by the fact that
roughly one-third of respondents expected higher interest rates while
one-third expected rates to fall. A separate question
indicated that 49.5% expected lower stock prices.
Confusion about the interest rate outlook was evident by the fact that
roughly one-third of respondents expected higher interest rates while
one-third expected rates to fall. A separate question
indicated that 49.5% expected lower stock prices.
The decline in overall consumer confidence over the last year has been greatest amongst higher income earners. It has been fairly uniform by age group.
An Experimental Investigation of Why Individuals Conform from the Federal Reserve Bank of New York can be found here.
Prospects for Macro- and Financial Policy is a recent speech given by Gary H. Stern, President of the Federal Reserve Bank of Minneapolis and it available here.
| Conference Board (SA, 1985=100) | February | January | Y/Y % | 2008 | 2007 | 2006 |
|---|---|---|---|---|---|---|
| Consumer Confidence Index | 25.0 | 37.4 | -67.3 | 57.9 | 103.4 | 105.9 |
| Present Situation | 21.2 | 29.7 | -79.6 | 69.9 | 128.8 | 130.2 |
| Expectations | 27.5 | 42.5 | -52.6 | 50.0 | 86.4 | 89.7 |
German IFO Survey Shows Little Change in the Dismal Appraisal of the Business Climate
by Louise Curley February 24, 2009
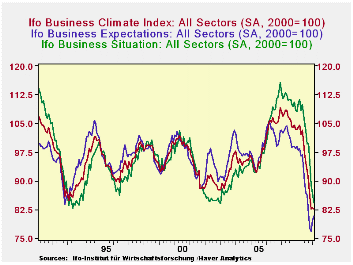
The latest release of the IFO survey of German entrepreneurs
engaged in industry and trade shows little change in their dismal
appraisal of the business climate. The overall business climate
indicator declined from 83.0 (2000=100) in January to 82.6 in February
to a new all time low.  Concern over current conditions outweighed a
slightly less negative appraisal of the outlook for the next six
months. The indicator for current conditions declined from 86.8 to 84.3
while that for the next six months rose from 79.5 to 80.9. All three
measures are below or, close to, their all time lows, as can be seen in
the first chart.
Concern over current conditions outweighed a
slightly less negative appraisal of the outlook for the next six
months. The indicator for current conditions declined from 86.8 to 84.3
while that for the next six months rose from 79.5 to 80.9. All three
measures are below or, close to, their all time lows, as can be seen in
the first chart.
 The indexes are based on the balance of opinions expressed by
the participants in the survey. The balance of opinion data are
published as well as the indexes, and, in the first release of the
data, only the balance of opinion data for the detailed business
sectors are given. Among the major business sectors, manufacturers are
the most pessimistic and they became more so in February, as the excess
of pessimists rose from 40.0% in January to 42.8%.
The indexes are based on the balance of opinions expressed by
the participants in the survey. The balance of opinion data are
published as well as the indexes, and, in the first release of the
data, only the balance of opinion data for the detailed business
sectors are given. Among the major business sectors, manufacturers are
the most pessimistic and they became more so in February, as the excess
of pessimists rose from 40.0% in January to 42.8%.  Those engaged in
construction and trade were less negative. Wholesalers, however, became
more pessimistic in February, going to -27.8% from -25.4% in January.
The climate in construction improved to -24.5% in February from -29.5%
in January. The comparable figures for retail trade were -24.3% and
26.5%. The balance of opinions for the major sectors are shown in the
second chart.
Those engaged in
construction and trade were less negative. Wholesalers, however, became
more pessimistic in February, going to -27.8% from -25.4% in January.
The climate in construction improved to -24.5% in February from -29.5%
in January. The comparable figures for retail trade were -24.3% and
26.5%. The balance of opinions for the major sectors are shown in the
second chart.
| GERMANY | Feb 09 | Jan 09 | Dec 08 | Nov 08 | Oct 08 | Sep 08 | Aug 08 |
|---|---|---|---|---|---|---|---|
| IFO Survey | |||||||
| Business Climate (2000=100) | 82.6 | 83.0 | 82.7 | 85.9 | 90.1 | 92.7 | 94.6 |
| Current Conditions (2000=100) | 84.3 | 86.8 | 88.8 | 94.8 | 99.9 | 99.6 | 103.0 |
| Condition 6 Months Ahead (2000=100) | 80.9 | 79.5 | 76.9 | 77.8 | 81.4 | 86.9 | 86.8 |
| Business Climate by Sector (Percent Balance) | |||||||
| Total | -35.4 | -34.4 | -35.2 | -28.8 | -20.5 | -15.2 | -11.4 |
| Manufacturing | -42.8 | -40.0 | -39.9 | -29.3 | -19.2 | -12.0 | -7.3 |
| Construction | -24.5 | -29.5 | -30.3 | -30.1 | -27.7 | -25.2 | -26.5 |
| Wholesale Trade | -27.8 | -25.4 | -26.2 | -21.8 | -15.3 | -10.9 | -5.7 |
| Retail Trade | -24.3 | -26.5 | -30.4 | -33.2 | -25.5 | -24.5 | -21.5 |

Tom Moeller
AuthorMore in Author Profile »Prior to joining Haver Analytics in 2000, Mr. Moeller worked as the Economist at Chancellor Capital Management from 1985 to 1999. There, he developed comprehensive economic forecasts and interpreted economic data for equity and fixed income portfolio managers. Also at Chancellor, Mr. Moeller worked as an equity analyst and was responsible for researching and rating companies in the economically sensitive automobile and housing industries for investment in Chancellor’s equity portfolio. Prior to joining Chancellor, Mr. Moeller was an Economist at Citibank from 1979 to 1984. He also analyzed pricing behavior in the metals industry for the Council on Wage and Price Stability in Washington, D.C. In 1999, Mr. Moeller received the award for most accurate forecast from the Forecasters' Club of New York. From 1990 to 1992 he was President of the New York Association for Business Economists. Mr. Moeller earned an M.B.A. in Finance from Fordham University, where he graduated in 1987. He holds a Bachelor of Arts in Economics from George Washington University.
More Economy in Brief