 Global| Jan 10 2020
Bank of France Survey Weakens But the BOF Outlook Is Held Steady
Summary
The Bank of France Business survey indicator has weakened in December, falling to 96.5 in December from 97.3 in November. At 96.5, it is below its 12-month average of 97.9 and its standings in December at 28.6 percentile since [...]
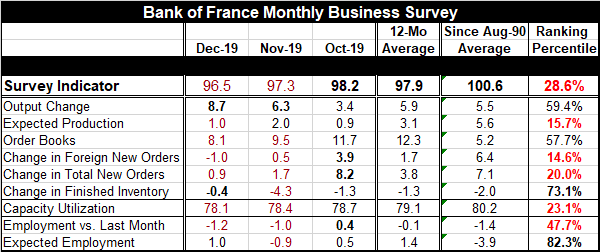
 The Bank of France Business survey indicator has weakened in December, falling to 96.5 in December from 97.3 in November. At 96.5, it is below its 12-month average of 97.9 and its standings in December at 28.6 percentile since November 1990.
The Bank of France (BOF) retained its growth forecast for the fourth quarter, however. According to the monthly survey, the BOF sees the economy as set to grow 0.2% in the fourth quarter, unchanged from the previous estimate. This is slower than the 0.3% growth posted in the third quarter.
The output change, detected by the survey on the month, saw its indicator rise to 8.7 in December from 6.3 in November and those readings are both up from 3.4 in October. The 12-month average for this indicator is 5.9. The change indicator itself in December has a 59.4 percentile standing, above its historic median change calculated on data back to November 1990.
Expected production moved lower to a reading 1.0 in December from 2.0 in November; it is also a tick above the 0.9 reading back in October. The 12-month average for expected production centers on a reading of 3.1, marking the December reading as weaker than that. The December reading has a 15.7 percentile standing – indicating in general terms that it has been weaker historically only about 16% of the time.
Meanwhile, the order books backed off to 8.1 in December from 9.5 in November and from 11.7 in October. These readings compare to a 12-month average for orders books at 12.3. Even with this slippage, the December reading still has a 57.7 percentile standing in its historic queue of data- still above its median result.
The change in orders for foreign orders and total news orders both show changes that are weaker month-to-month and weaker substantially when compared to their respective October levels. Foreign orders have a -1.0 December value compared to 3.9 in October and compared to a 12-month average of 1.7. The change in new orders has a December value of 0.9, down from 1.7 in November and 8.2 in October; those values compare to a 3.8 average value over 12 months. Foreign orders have a 14.6 percentile standing in December while total orders have a 20.0 percentile standing. Both of these are very weak; they are in the bottom one-fifth of their historic standings.
Inventories continue to post negative values, but the negative reading in December is a stronger reading than it had in November. The -0.4 reading of December is also stronger than its -1.3 twelve-month average. Inventory readings are often negative as you can tell from the ranking of the December reading which is at a 73.1 percentile standing nearly a top one-quarter standing despite its negative value. This may be an indicator that firms have completed much of the inventory reduction they previously had been seeking.
Over the past 12 months, capacity usage has slipped. It fell month-to-month to 78.1 from 78.4. The December value of 78.1 compares to a 12-month average of 79.1. December has a weak 23.1 percentile standing.
Employment continues to log relatively strong readings and readings that are strong in the face of other readings and weaker standings in this survey. Month-to-month, however, the jobs metric for employment is at -1.2, weaker than November's -1.0 reading. December is also weaker than the 12-month average of -0.1. The standing of the December reading is just below its historic median as it logs a 47.7 percentile standing. That is vastly stronger than the overall survey indicator (that stands at 28.6%) but is more in line with the standings of the output change and the order book indicator. Expected employment, however, is hot. It has rebounded to 1.0 reading in December from -0.9 in November. These two monthly readings are below its 12-month average of 1.4. Still, the December value of 1.0 has a queue standing in its 82.3 percentile, making expected employment the strongest component in this survey.
The correlations among the components of this survey also are telling. The employment change month-to-month is most closely correlated with expected employment even though these are two rather different concepts. However, employment month-to-month is also highly correlated to order books and output changes with higher correlations to those concepts than expected employment has.
Capacity utilization is most highly correlated with order books.
The change in finished inventories has low correlations with everything but has its best correlations with order books, output changes and capacity utilization – basically these are correlations that confirm accelerator model inventory behavior.
Changes in new orders have their highest correlation with changes in new foreign orders. There is a lesser correlation with expected production which should be a first cousin to more orders.
Changes in foreign orders have their highest correlation to changes in total orders (which would also contain the survey results from foreign orders). There is a lesser but strong correlation to expected production.
Order books correlate very strongly to output change, perhaps indicating a large role for nondurable goods industries with orders filled more immediately rather than in the distant future. Order books also have a strong but lesser correlation with capacity and with month-to-month employment. Interestingly, order books have only a modest positive correlation to expected production.
Expected production correlates the most strongly to the two 'change in orders' series, total and foreign orders.
Output change has its strongest correlation with order books. For these two series each one's highest correlation is with the other again emphasizing that orders may be of a highly short term quickly filled nature dominated by nondurable goods.
The survey indicator has its highest correlation with order books, followed by the change in foreign orders, then the change in new orders and finally output change. Expected production also has a correlation with the survey indicator of above 0.8.
On balance, the French manufacturing survey and its interior correlations seems to guide us to the notion that the survey has very strong connections to industries with short term lags. In fact the business gauge has its highest correlations with French retail furniture sales and textile sales with negative correlations to other durable goods categories of consumer goods sales.

Robert Brusca
AuthorMore in Author Profile »Robert A. Brusca is Chief Economist of Fact and Opinion Economics, a consulting firm he founded in Manhattan. He has been an economist on Wall Street for over 25 years. He has visited central banking and large institutional clients in over 30 countries in his career as an economist. Mr. Brusca was a Divisional Research Chief at the Federal Reserve Bank of NY (Chief of the International Financial markets Division), a Fed Watcher at Irving Trust and Chief Economist at Nikko Securities International. He is widely quoted and appears in various media. Mr. Brusca holds an MA and Ph.D. in economics from Michigan State University and a BA in Economics from the University of Michigan. His research pursues his strong interests in non aligned policy economics as well as international economics. FAO Economics’ research targets investors to assist them in making better investment decisions in stocks, bonds and in a variety of international assets. The company does not manage money and has no conflicts in giving economic advice.
More Economy in Brief


