 Global| Jun 09 2006
April U.S. Trade Deficit Deepened Less Than Expected
by:Tom Moeller
|in:Economy in Brief
Summary
During April the U.S. foreign trade deficit deepened to $63.4B from a little revised $61.9B in March. The deficit fell short of Consensus expectations for $65.1B. The latest deficit was the deepest since the near-record in January of [...]
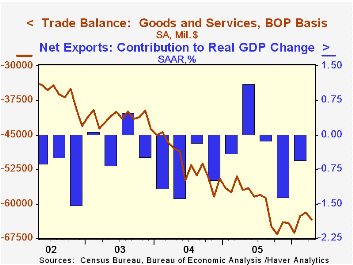
During April the U.S. foreign trade deficit deepened to $63.4B from a little revised $61.9B in March. The deficit fell short of Consensus expectations for $65.1B.
The latest deficit was the deepest since the near-record in January of $66.2B. During the first four months of 2006 the foreign trade deficit averaged $63.5B versus a $56.3B deficit averaged during the first four months of 2005.
Total exports slipped 0.2% in April after the 1.8% pop during March. Nonauto consumer goods exports led the decline with a 3.5% slide (+5.0% y/y) which reflected lower apparel & appliance (+12.2% y/y) exports that had been strong. Capital goods exports also slipped 0.5% (+9.2% y/y) while exports of advanced technology products fell 13.5% (NSA, +6.0% y/y). Exports of industrial supplies & materials rose 0.2% (13.4% y/y) and automotive exports rose 1.0% (8.9% y/y).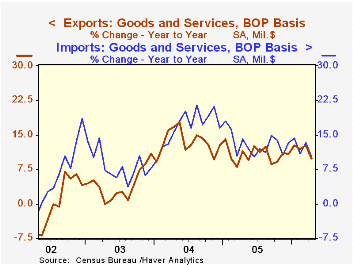
April imports rose just 0.7% though a 6.4% (22.5% y/y) rise in petroleum imports wholly reflected higher prices. In constant dollars petroleum imports fell 3.7% (-5.2% y/y). The per day quantity of all energy-related petroleum product imports fell 1.5% (-5.1% y/y) but crude oil prices rose 8.7% (26.9% y/y) to an average $56.82 per bbl.
Imports of capital goods ticked up 0.3% (8.8% y/y) and are up 4.7% year to date. Imports of advanced technology products fell 15.1% (NSA, +2.9% y/y) and imports of nonauto consumer goods fell 3.5% (+5.0% y/y).
The US trade deficit with China deepened to $17.0B ($201.6B for 2005) while the trade deficit with Japan deepened to $7.8B ($82.7B in 2005). The trade deficit with the Asian NICs rose to a still modest $0.7B ($15.9B in 2005). Growth in both exports & imports with the Asian NICs has been firm. The deficit with the European Union eased to $9.4B ($122.4B in 2005).
| Foreign Trade | April | March | Y/Y | 2005 | 2004 | 2003 |
|---|---|---|---|---|---|---|
| Trade Deficit | $63.4B | $61.9B | $57.0B (4/05) | $716.7B | $611.3B | $494.9B |
| Exports - Goods & Services | -0.2% | 1.8% | 9.8% | 10.7% | 13.4% | 4.2% |
| Imports - Goods & Services | 0.7% | 0.7% | 10.3% | 13.0% | 16.7% | 8.3% |
by Tom Moeller June 9, 2006
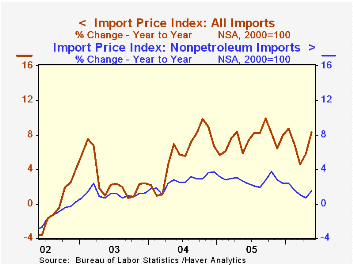
Total import prices advanced another 1.6% last month after a 2.1% jump during April. Again, the rise easily surpassed Consensus expectations which had been for a 0.7% increase.
Import prices less petroleum jumped 0.6%, the strongest monthly gain since October. That strength was led by higher prices for nonoil industrial materials which surged 2.5% (9.0% y/y) reflecting firm prices for paper (5.9% y/y), nonferrous metals (49.7% y/y) and chemicals (5.5% y/y).
Capital goods prices were unchanged as they have been all year (-1.6% y/y) and excluding computers, capital goods prices rose just 0.1% (0.6% y/y). Prices for nonauto consumer goods rose 0.3% (-0.1% y/y) following two months of decline. 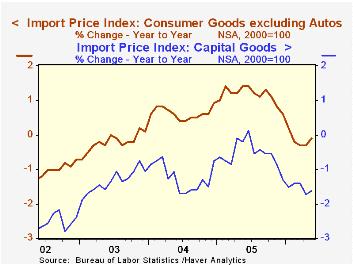
During the last ten years there has been a 66% (negative) correlation between the nominal trade-weighted exchange value of the US dollar vs. major currencies and the y/y change in non oil import prices. The correlation is a lower 47% against a broader basket of currencies and a lower 57% against the real value of the dollar.
Petroleum prices posted a 5.2% increase but recent declines in crude oil prices suggest moderation.
Export prices were firm again and rose 0.7%. Pricing strength has been broad based for industrial supplies (10.9% y/y) but foods & beverages are down 1.2% (y/y), capital goods prices are just 0.2% higher y/y while nonauto consumer goods exports prices are up 1.0% y/y.
| Import/Export Prices (NSA) | May | April | Y/Y | 2005 | 2004 | 2003 |
|---|---|---|---|---|---|---|
| Import - All Commodities | 1.6% | 2.1% | 8.3% | 7.5% | 5.6% | 2.9% |
| Petroleum | 5.2% | 11.5% | 45.7% | 37.6% | 30.5% | 21.0% |
| Non-petroleum | 0.6% | 0.1% | 1.5% | 2.7% | 2.6% | 1.1% |
| Export - All Commodities | 0.7% | 0.6% | 3.4% | 3.2% | 3.9% | 1.6% |
by Tom Moeller June 9, 2006
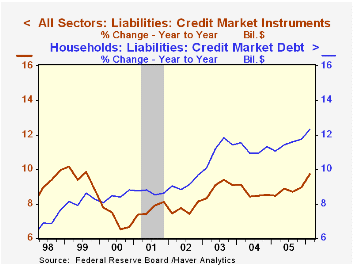
Growth in total credit market debt outstanding rose 10.2% (AR) last quarter. That was a modest slowdown from the 12.1% advance during 4Q but it was enough to lift the y/y rate of growth to 9.7%, its fastest since 1999.
A jump in borrowing by the Federal government continued to lead debt growth with a 14.0% (AR) advance last quarter, its fastest in a year.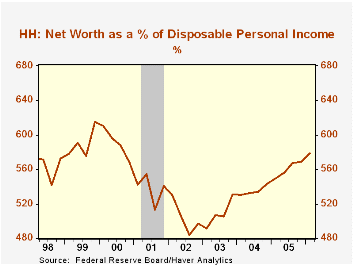
Moving in the other direction, growth in household sector borrowing slowed to 9.1%, its slowest quarterly gain in a year following the 11.7% surge during all of 2005.Home mortgage obligations grew at a still firm 12.6% rate (14.7% y/y) but consumer credit fell at a 5.1% (AR, +2.5% y/y). Bank loans jumped 12.3% (50.0% y/y).
Business borrowing picked up a bit and grew at an 8.3% annual rate (6.3% y/y).
Household sector asset values rose at a 10.8% annual rate (10.4% y/y) during 1Q driven by a 10.1% (14.6% y/y) gain in the value of real estate holdings. Financial asset values rose 11.6% (8.7% y/y) due to a 40.5% (AR, 20.3% y/y) rise in the value of mutual fund shares. The value of corporate equities held directly ticked up 0.7% (-1.6% y/y).
The net worth of the US household sector last quarter rose 2.7% (10.1% y/y) to a record $53.830 trillion. The gain lifted the ratio of net worth to income to 5.79 times.
| Flow of Funds | % of Total | 1Q 06 (AR) |
4Q 05 (AR) |
Y/Y | 2005 | 2004 | 2003 |
|---|---|---|---|---|---|---|---|
| Total Credit Market Debt Outstanding | 10.2% | 12.1% | 9.7% | 8.9% | 8.5% | 9.1% | |
| Federal Government | 12% | 14.0% | 10.1% | 6.5% | 7.0% | 9.0% | 10.9% |
| Households | 28% | 9.1% | 13.2% | 12.3% | 11.7% | 11.3% | 11.4% |
| Nonfinancial Corp. Business | 14% | 8.3% | 6.1% | 6.3% | 5.5% | 3.7% | 2.3% |
| Financial Sectors | 32% | 11.0% | 14.9% | 9.8% | 8.3% | 7.9% | 10.0% |
| Net Worth: Households & Nonprofit Organizations (Trillions) | -- | $53.830 | $52.430 | -- | $52.430 | $48.470 | $44.206 |
| Tangible Assets | -- | $26.223 | $25.626 | 13.0% | $25.626 | $22.556 | $20.036 |
by Carol Stone June 9, 2006
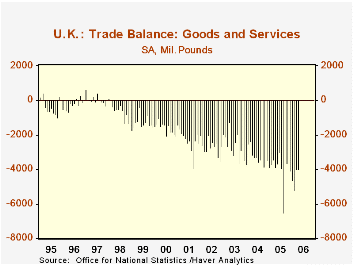
We talked about UK trade just a month ago, but it seems worth revisiting right away. The trade deficit (on goods and services) in April held at March's level, £4.0 billion (a slight revision from the initial £3.8 billion). Both exports and imports eased, imports for a second month. At £33.8 billion, imports are 2.5% below their February peak. Exports edged down 0.4% in April after a 1.7% increase in March. Even so, both exports and imports remain substantially above comparable 2005 amounts. 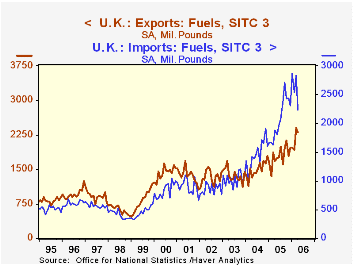
Two-way trade in fuel remains an important contributor to total UK trade flows even though fuel is only around 8% of both total exports and imports. But exports of crude oil fell 17.6% in April after a 48.3% jump in March. Volume dropped while prices continued rising. The value per tonne increased 6% in April alone. Notably, other exports, excluding fuels, held steady with March and are still more than 13% above a year ago.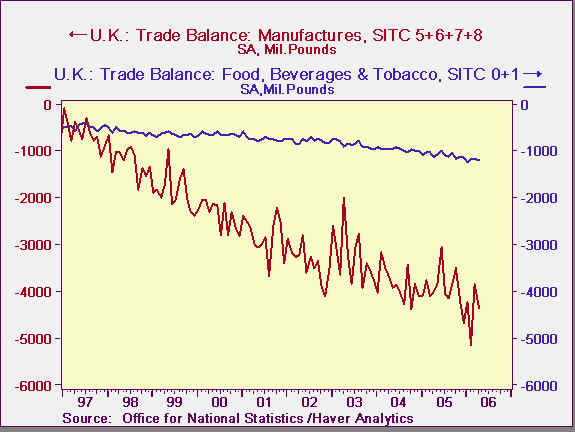
Imports of fuel had risen sharply in March and dropped even more sharply in April, maintaining a wide seesaw pattern for a fourth month. As with fuel exports, volume corrected while prices continued rising. A £0.6 billion decline in the value of fuel imports more than offset an increase in other goods and services of 1.5%.
Among non-fuel products, manufactures are sustaining a trade deficit of about £4.4 billion, although there is some tendency toward an improving turn as exports are growing while imports have moderated in both March and April. The other major segment showing a trade deficit is food, with food imports growing steadily while exports remain flat. That generates a widening deficit that reached £1.2 billion on average for the first four months this year, 26% of the total trade deficit.
| UK Trade, SA, Bil.£ | Apr 2006 | Mar 2006 | Feb 2006 | Apr 2005 | Monthly Averages|||
|---|---|---|---|---|---|---|---|
| 2005 | 2004 | 2003 | |||||
| Trade Balance: Goods & Services | -3.98 | -4.00 | -5.22 | -3.86 | -4.05 | -3.29 | -2.64 |
| Exports | 29.90 | 30.01 | 29.52 | 26.07 | 26.41 | 24.49 | 23.50 |
| Imports | 33.88 | 34.01 | 34.75 | 29.93 | 30.46 | 27.78 | 26.14 |
| Goods | -5.75 | -5.71 | -7.18 | -5.65 | -5.61 | -5.07 | -4.05 |
| Fuels | +0.07 | -0.43 | -0.61 | -0.20 | -0.29 | 0.03 | 0.35 |
| Exports | 2.30 | 2.40 | 1.93 | 1.68 | 1.79 | 1.49 | 1.38 |
| Imports | 2.23 | 2.83 | 2.54 | 1.88 | 2.08 | 1.46 | 1.03 |
| Services | 1.77 | 1.71 | 1.96 | 1.79 | 1.56 | 1.79 | 1.41 |

Tom Moeller
AuthorMore in Author Profile »Prior to joining Haver Analytics in 2000, Mr. Moeller worked as the Economist at Chancellor Capital Management from 1985 to 1999. There, he developed comprehensive economic forecasts and interpreted economic data for equity and fixed income portfolio managers. Also at Chancellor, Mr. Moeller worked as an equity analyst and was responsible for researching and rating companies in the economically sensitive automobile and housing industries for investment in Chancellor’s equity portfolio. Prior to joining Chancellor, Mr. Moeller was an Economist at Citibank from 1979 to 1984. He also analyzed pricing behavior in the metals industry for the Council on Wage and Price Stability in Washington, D.C. In 1999, Mr. Moeller received the award for most accurate forecast from the Forecasters' Club of New York. From 1990 to 1992 he was President of the New York Association for Business Economists. Mr. Moeller earned an M.B.A. in Finance from Fordham University, where he graduated in 1987. He holds a Bachelor of Arts in Economics from George Washington University.
More Economy in Brief


