 Global| Jan 07 2009
ADP Report: Payroll EmploymentFell By 693,000
by:Tom Moeller
|in:Economy in Brief
Summary
The payroll processor ADP indicated in its latest National Employment Report that December private nonfarm payrolls fell 693,000. The decline followed a revised 476,000 November drop that was much deeper than the initial estimate. The [...]
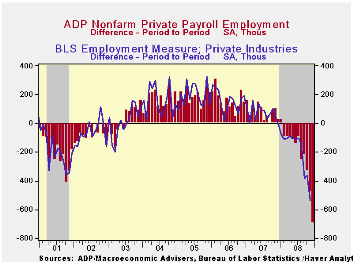 The
payroll processor ADP indicated in its latest National Employment
Report that December private nonfarm payrolls fell 693,000. The decline
followed a revised 476,000 November drop that was much deeper than the
initial estimate. The latest was the eleventh consecutive monthly
decline. During the last three months payrolls have fallen 1.3%.
The
payroll processor ADP indicated in its latest National Employment
Report that December private nonfarm payrolls fell 693,000. The decline
followed a revised 476,000 November drop that was much deeper than the
initial estimate. The latest was the eleventh consecutive monthly
decline. During the last three months payrolls have fallen 1.3%.
The U.S. Bureau of Labor Statistics will report on December payroll employment this Friday. Last month, the 476,000 worker decline (-1.6% y/y) in ADP's measure of private nonfarm payrolls was accompanied by a 540,000 worker decline (-1.8% y/y) in the BLS measure of private sector payrolls.
 According
to ADP and Macro Advisers, the correlation between the monthly
percentage change in the ADP estimate and that in the BLS data is 0.90.
ADP indicated in today's report that it is the first to incorporate
key methodological revisions. These revisions include improved modeling
techniques and additional data sources to better accommodate inherent
differences between the ADP and BLS data.
The impact on recent
estimates was to revise the monthly declines in employment much deeper.
According
to ADP and Macro Advisers, the correlation between the monthly
percentage change in the ADP estimate and that in the BLS data is 0.90.
ADP indicated in today's report that it is the first to incorporate
key methodological revisions. These revisions include improved modeling
techniques and additional data sources to better accommodate inherent
differences between the ADP and BLS data.
The impact on recent
estimates was to revise the monthly declines in employment much deeper.
Employment in the service producing industry was most pronounced. December payrolls fell 473,000 (-1.5% y/y), the eleventh consecutive monthly decline and the service sector estimates are the source for most of the downward revision in the overall payroll figure. Medium sized payrolls fell 215,000 (-1.8% y/y) and small sized payrolls fell 201,000 (-1.1% y/y). Large service producing payrolls dropped by 57,000 (-1.8% y/y).
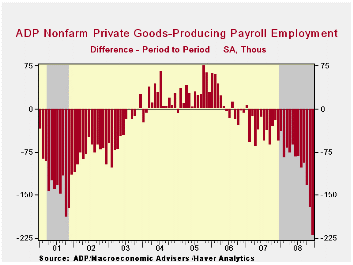
Weakness in goods producing
payrolls added to the service sector's decline. Payrolls fell by
220,000 (-5.6% y/y). The largest decline was amongst medium sized
payrolls which fell 106,000 (-5.5% y/y) followed by an 80,000 (-5.3%
y/y) drop in small sized payrolls. Large payrolls fell 34,000 (-6.4%
y/y).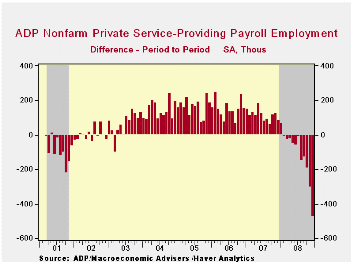
Employment in the manufacturing sector fell 120,000 (-5.1% y/y) It has fallen in most every month since 2001.
ADP compiled the estimate from its database of individual companies' payroll information. Macroeconomic Advisers, LLC, the St. Louis economic consulting firm, developed the methodology for transforming the raw data into an economic indicator.
The ADP National Employment Report data is maintained in Haver's USECON database; historical data go back to December 2000. The figures in this report cover only private sector jobs and exclude employment in the public sector, which rose an average 11,083 during the last twelve months.
The full ADP National Employment Report can be found here, and the ADP methodology is explained here.
| LAXEPA@USECON | December | November | Y/Y | 2008 | 2007 | 2006 |
|---|---|---|---|---|---|---|
| Nonfarm Private Payroll Employment (m/m Chg.) | -693,000 | -476,000 | -2.2% | -0.4 | 1.2% | 2.0% |
by Tom Moeller January 7, 2009
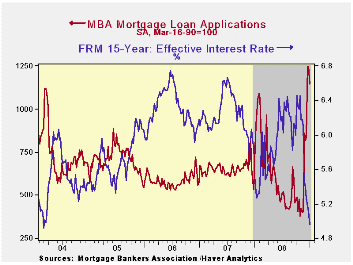
According to the Mortgage Bankers Association, the total
number of mortgage applications fell a slight 8.2% last week after
having been unchanged during the prior week. Nevertheless, applications
remained firm to take advantage of lower interest rates and the Fed's announcement
that it would buy the debt of government sponsored enterprises (GSE)
and mortgage-backed securities (MBS).They are up by more
than from the year ago level.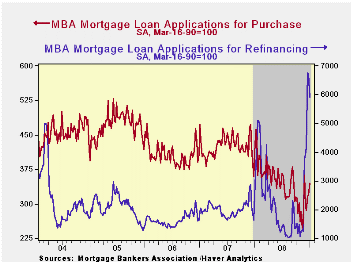
The index of applications to refinance a home mortgage dipped for the second week after having risen by two-thirds near the end of last month. They have risen by three times due to lower interest rates and the government's guarantee.
Applications for a mortgage to purchase a home rose for the third consecutive week and were up by one third from their November low.
The effective interest rate on a conventional 15-year mortgage fell again to 4.96% and that left rates down 140 basis points from the October average. For a 30-year mortgage rates also fell to 5.30%. Interest rates on 15 and 30 year mortgages are closely correlated (>90%) with the rate on 10-year Treasury securities. For an adjustable rate 1-Year mortgage the rate fell to 5.98%, down a full percentage point from this past Fall
During the last ten years there has been a (negative) 79% correlation between the level of applications for purchase and the effective interest rate on a 30-year mortgage. Moreover, during the last ten years there has been a 61% correlation between the y/y change in purchase applications and the change in new plus existing single family home sales.
The Mortgage Bankers Association surveys between 20 to 35 of the top lenders in the U.S. housing industry to derive its refinance, purchase and market indexes. The weekly survey covers roughly 50% of all U.S. residential mortgage applications processed each week by mortgage banks, commercial banks and thrifts. Visit the Mortgage Bankers Association site here.
The figures for weekly mortgage applications are available in Haver's SURVEYW database.
| MBA Mortgage Applications (3/16/90=100) | 01/02/09 | 12/26/08 | Y/Y | 2008 | 2007 | 2006 |
|---|---|---|---|---|---|---|
| Total Market Index | 1,143.8 | 1,245.7 | 62.0% | 642.9 | 652.6 | 584.2 |
| Purchase | 344.2 | 320.9 | -16.9% | 345.4 | 424.9 | 406.9 |
| Refinancing | 5,904.5 | 6,733.8 | 136.7% | 2,394.1 | 1,997.9 | 1,634.0 |
by Tom Moeller January 7, 2009
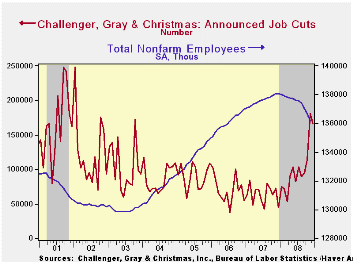
Challenger, Grey & Christmas reported that job cut announcements in December fell back slightly to 166,348 following the indication of 181,671 layoffs during November. Despite the drop, however, the number of layoffs was nearly four times the level of December 2007.
According to the report from ADP, the service sector lost 473,000 jobs and the manufacturing industry lost 120,000 jobs.
Job cut announcements in the financial industry totaled 39,604, up more than six times from a year earlier, while layoffs in the entertainment & leisure industry totaled 6,739, up more than five times from December of '07. Layoffs in retail totaled 17,783, nearly double one year earlier, while in services there were 5,064 job cuts, up nearly ten times from one year ago. In the media industry 2,533 jobs were cut. In the auto industry 6,539 jobs were lost, electronics shed 11,520 positions and 17,968 jobs were shed from the chemical industry, up fifteen times from December of '07.
During the last ten years there has been a 67% (inverse) correlation between the three month moving average of announced job cuts and the three month change payroll employment.
Job cut announcements differ from layoffs. Many are achieved through attrition, early retirement or just never occur.
Challenger also reported that announced hiring plans were roughly stable with the prior three months.
The Challenger figures are available in Haver's SURVEYS database.
| Challenger, Gray & Christmas | December | November | Y/Y | 2008 | 2007 | 2006 |
|---|---|---|---|---|---|---|
| Announced Job Cuts | 166,348 | 181,671 | 274.5% | 1,223,993 | 768,264 | 839,822 |
by Tom Moeller January 7, 2009
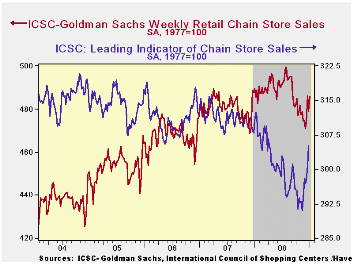
Chain store sales last week recovered all of the previous week's decline with a 1.4% increase, according to the International Council of Shopping Centers-Goldman Sachs Index. The rise lifted sales 1.7% above their December average which rose by a scant 0.3% from November. That followed three months of sharp decline.
The ICSC-Goldman Sachs retail chain-store sales index is constructed using the same-store sales (stores open for one year) reported by 78 stores of seven retailers: Dayton Hudson, Federated, Kmart, May, J.C. Penney, Sears and Wal-Mart.
Perhaps better news on sales are in store. The weekly leading indicator of chain store sales from ICSC-Goldman Sachs jumped another 1.4% after a 1.1% rise during the prior week. And since the lows of several weeks ago the index has recovered 4.7%.
The chain store sales figures are available in Haver's SURVEYW database.
Is There Less Agreement About Inflation? from the Federal Reserve Bank of St. Louis can be found here.
| ICSC-UBS (SA, 1977=100) | 01/02/09 | 12/26/08 | Y/Y | 2008 | 2007 | 2006 |
|---|---|---|---|---|---|---|
| Total Weekly Chain Store Sales | 485.6 | 478.9 | -0.8% | 1.4% | 2.8% | 3.3% |
by Robert Brusca January 7, 2009
Short term inflation: dropping like a feather in a
vacuum
Like the HICP report the EMU PPI report shows a sharp ongoing
drop in prices. Inflation has been cut sharply over short horizons. The
headline (X construction) is dropping at an 11% annualized pace over
three months and at a pace of -2.3% over six months. Yr/Yr the rate is
still positive at 2.3%.
Short term Ex energy trends are solid
Ex energy inflation at the PPI level in November is at a
-4.9% rate over 3-mos, a -0.2% pace over 6-mos and at +2.3% over
12-mos. The trending is the same: over shorter horizons the pace of
decline is more severe. This is what confirms that inflation is still
decelerating and has not yet stopped decelerating. In November both
total and ex energy inflation fell sharply month-to-month.
However…
For those who want to be more cautious, or even fearful of what may lie
in store over longer periods, the Yr/Yr charts are telling a different
story.
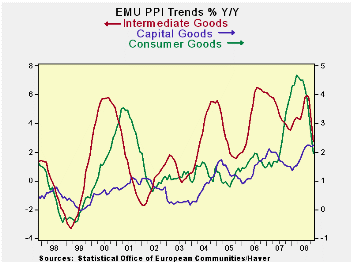
For the PPI inflation’s TREND is still…RISING
The chart shows that inflation viewed over long spans of time
also has cycles and the various sectors show there has been some
inflation percolating, cycling around an upward trend going back to the
sector lows around 1999. For ex energy inflation (not pictured) the low
dates from early 2002.
Inflation has cycles
Let’s use intermediate goods as the baseline example since
its cycles are clear. It has local inflation cycle peaks in 2000, 2003,
2004, 2006 and lower ‘peak’ in 2008. Other sectors have approximately
the same cycles with varying amplitudes. But for each sector the same
thing is true: the underlying trend for INFLATION has been rising as
the various cycles have gone through their respective boom-bust phases.
So the essential question is whether policy should look at where we are
in this inflation cycle or to be more worried about the underlying
rising inflation trend?
Identifying the trend
If you imagine a line touching the lowest point in each
inflation cycle for each sector you will note that intermediate goods
inflation is now below its lower cycle trend line (that slopes up) but
that has only just happened. Consumer goods inflation at the PPI level
is still above its trend (similarly constructed), so despite its
current plunge, the long term trend of consumer goods inflation
acceleration is still in play. Capital goods prices are still on the
rise and inflation has really not fallen significantly yr/yr for
capital goods. Taking ex energy inflation as an extra category (but not
pictured) we find that that series is below its cycle low point trend
line in 2008, but that is a very new development. It could signal that
the long term inflation uptrend is really is getting broken. But, of
course, the inflation dynamic is created in tandem with the growth
dynamic so policymakers need to keep the whole picture in mind to
decide. By the way, with fewer cycles to contend with it is clear that
this same logic applies to the EMU HICP rate through December. Its
inflation reading is falling rapidly but clearly has only just dropped
below its ceiling. History is replete with spikes down in inflation
that did not last. What is the ECB to do?
What went wrong?
If there is one thing this cycle has taught us it is to think
outside the box – or at least to plan ahead and think broadly. The
ECB’s backward looking Yr/Yr inflation ceiling did not serve it well to
make policy in this cycle. It kept the bank too tight for too long.
Only the financial crises with the ECB rate cut masked as part of a
global effort allowed it to bring rates lower with inflation still well
above its ‘ceiling.’ Inflation continued its rise in its headline even
as energy prices broke lower; it took an unprecedented crash in oil
prices to bring the headline back into the required zone (this
references HICP inflation).
Lessons from the brink and over the edge
The point we keep coming back to in this regard is that
decisions on interest rates need to be broader than just to look at a
headline price series- even if containing that series is the ultimate
policy goal. The Fed’s policy of looking at core inflation served it
much better in the cycle and provided a solid basis from which to
engineer that global coordinated rate cut that kicked things off while
the ECB’s headline inflation series was still well above its ‘ceiling’.
The ECB would be well advised to seek a more stable target for its
policy focus or it will again find itself behind the policy and
credibility eight-ball.
The policy dilemma
Looking ahead the ECB has a different sort of decision to
make. As we can see short term inflation is cycling lower, but on a
longer term perspective inflation trends do not look so unambiguously
good. What’s the ECB to do? On the basis of Yr/Yr inflation despite the
very rapid plunge in prices it is possible to continue to hear calls of
caution (from places like…Germany?) about the need to cut interest
rates. Yet the economy is weakening and the plunge in short term
inflation seems to be another signal about much weakness is cumulating.
The ECB probably will cut rates again but I expect there to be some
reluctance as Europe has not grasped the magnitude of this financial
crises and economic slowdown from the start. I don’t expect it to
become a believer now even though it finally agreed to take more
aggressive steps on the fiscal and monetary side. Call it
euro-reluctance, or something else, but it’s there and it is resistant
to the very idea of stimulus of any sort.
| M/M | Saar | |||||
| Euro Area 15 | Oct-08 | Sep-08 | 3-Mo | 6-Mo | Yr/Yr | Y/Y Yr Ago |
| Total excl Constructions | -0.8% | -0.3% | -5.8% | 4.1% | 6.3% | 3.3% |
| Excl Energy | -0.4% | 0.0% | -1.0% | 2.0% | 3.2% | 3.2% |
| Capital Goods | 0.0% | 0.1% | 1.2% | 2.0% | 2.2% | 1.5% |
| Consumer Goods | -0.1% | -0.1% | -0.1% | 1.0% | 2.6% | 3.4% |
| Intermediate & Capital Goods | -0.6% | 0.0% | -1.6% | 2.5% | 3.6% | 3.0% |
| Energy | -2.0% | -1.0% | -18.9% | 9.9% | 15.8% | 4.3% |
| MFG | -1.5% | -0.5% | -9.9% | 0.1% | 3.5% | 3.9% |
| Germany | 0.0% | 0.3% | -1.2% | 7.3% | 7.8% | 1.7% |
| Excl Energy | -0.3% | 0.1% | 0.0% | 2.7% | 2.9% | 2.4% |
| Italy | -1.5% | -0.5% | -7.7% | 2.0% | 5.2% | 3.7% |
| Excl Energy | -0.7% | -0.1% | -2.3% | 0.8% | 3.0% | 3.2% |
| UK | -4.2% | -1.0% | -26.7% | -0.8% | 11.4% | 5.9% |
| Excl Energy | -0.5% | 0.3% | -0.7% | 5.6% | 7.0% | 3.8% |
| Euro Area 15 Harmonized PPI excluding Construction | ||||||

Tom Moeller
AuthorMore in Author Profile »Prior to joining Haver Analytics in 2000, Mr. Moeller worked as the Economist at Chancellor Capital Management from 1985 to 1999. There, he developed comprehensive economic forecasts and interpreted economic data for equity and fixed income portfolio managers. Also at Chancellor, Mr. Moeller worked as an equity analyst and was responsible for researching and rating companies in the economically sensitive automobile and housing industries for investment in Chancellor’s equity portfolio. Prior to joining Chancellor, Mr. Moeller was an Economist at Citibank from 1979 to 1984. He also analyzed pricing behavior in the metals industry for the Council on Wage and Price Stability in Washington, D.C. In 1999, Mr. Moeller received the award for most accurate forecast from the Forecasters' Club of New York. From 1990 to 1992 he was President of the New York Association for Business Economists. Mr. Moeller earned an M.B.A. in Finance from Fordham University, where he graduated in 1987. He holds a Bachelor of Arts in Economics from George Washington University.
More Economy in Brief


