 Global| Mar 04 2009
ADP Report: Payroll Employment Off 697,000
by:Tom Moeller
|in:Economy in Brief
Summary
The payroll processor ADP indicated in its latest National Employment Report that private nonfarm payrolls fell 697,000 last month. That followed a 614,000 decline during January which was revised from the initial estimate of a [...]
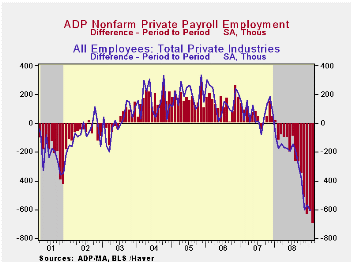
The payroll processor ADP indicated in its latest National Employment Report that private nonfarm payrolls fell 697,000 last month. That followed a 614,000 decline during January which was revised from the initial estimate of a 522,000 decline. The reading was the fourteenth consecutive monthly decline and during the last three months payrolls have fallen at a 6.7% annual rate. Last month medium sized payrolls fell 314,000 followed by a 262,000 worker decline in small sized payrolls. Large payrolls fell by 121,000.
The U.S. Bureau of Labor Statistics will report payroll employment this Friday. For comparison, January's 614,000 worker decline (-2.9% y/y) in ADP's measure of private nonfarm payrolls was accompanied by a 604,000 worker decline (-3.2% y/y) in the BLS measure of private sector payrolls. According to ADP and Macro Advisers, the correlation between the monthly percentage change in the ADP estimate and that in the BLS data is 0.90.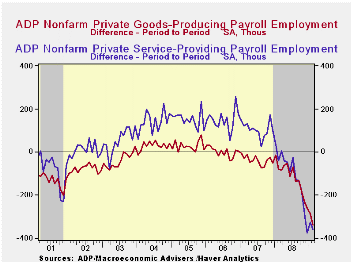
ADP reported that weakness in goods producing payrolls resulted in job declines last month of 338,000 (-8.9% y/y). Medium sized payrolls fell 155,000 (-9.2% y/y) followed by a 116,000 (-8.0% y/y) shortfall in small sized payrolls. Large payrolls fell 67,000 (-9.8% y/y). In the manufacturing sector alone, payrolls fell 219,000 (-9.0% y/y). It has fallen in almost every month since 2001.
Employment in the service producing industry fell hard as well and about as it did during the prior two months. The 359,000 (-2.1% y/y) decline was the eleventh consecutive monthly decline. Medium sized payrolls fell 159,000 (-2.4% y/y) and small sized payrolls fell 146,000 (-1.7% y/y). Large service producing payrolls dropped by 54,000 (-2.6% y/y).
ADP compiled the estimate from its database of individual companies' payroll information. Macroeconomic Advisers, LLC, the St. Louis economic consulting firm, developed the methodology for transforming the raw data into an economic indicator.
The ADP National Employment Report data is maintained in Haver's
USECON database; historical figures date back to December 2000. The figures in this report cover only private sector jobs and exclude employment in the public sector, which rose an average 11,083 during the last twelve months.The full ADP National Employment Report can be found here, and the ADP methodology is explained here.
Payments Fraud: Perception Versus Reality - A Conference Summary from the Federal Reserve Bank of Chicago is available here.
| LAXEPA@USECON | February | January | Y/Y | 2008 | 2007 | 2006 |
|---|---|---|---|---|---|---|
| Nonfarm Private Payroll Employment (m/m Chg.) | -697,000 | -614,000 | -3.4% | -0.4 | 1.2% | 2.0% |
by Tom Moeller March 4, 2009
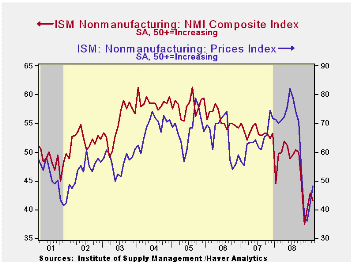
The Composite Index for the nonmanufacturing sector from the Institute for Supply Management (ISM) slipped in February to 41.6 from an unrevised January reading of 42.9. Consensus expectations were for a somewhat larger decline to 41.0. Despite the latest drop the index remained, for the third month, improved from the low of last November. A level of the ISM indices below 50 indicates declining activity. Since the series' inception in 1997 there has been a 48% correlation between the level of the business activity index for the nonmanufacturing sector and the Q/Q change in real GDP for the services and the construction sectors.
Deterioration in the overall figure last month was broad based
including moderate declines in the business activity sub-component and
the new orders sub-index The supplier deliveries index fell to a new
low indicating little delay in making deliveries.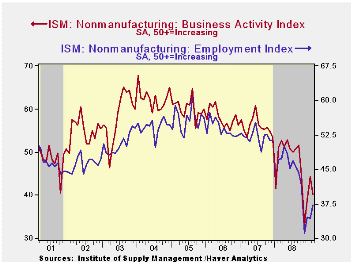
The employment index improved again and was up moderately from the November low. Since the series' inception in 1997 there has been a 56% correlation between the level of the ISM nonmanufacturing employment index and the m/m change in payroll employment in the service-producing plus the construction industries.
Pricing power rose further to the highest level since October. Since its inception ten years ago, there has been a 60% correlation between the price index and the q/q change in the GDP services chain price index.
Beginning with the January 2008 Nonmanufacturing Report On Business®, the composite index is calculated as an indicator of the overall economic condition for the non-manufacturing sector. It is a composite index based on the diffusion indices for four of the indicators (business activity, new orders, employment and supplier deliveries) with equal weights. The latest report from the ISM can be found here.
ISM surveys more than 370 purchasing managers in more than 62 industries including law firms, hospitals, government and retailers. The nonmanufacturing survey dates back to July 1997.
| ISM Nonmanufacturing Survey | February | January | February '08 | 2008 | 2007 | 2006 |
|---|---|---|---|---|---|---|
| Composite Index | 41.6 | 42.9 | 49.7 | 47.4 | 53.5 | 55.7 |
| Prices Index | 48.1 | 42.5 | 70.1 | 66.0 | 63.8 | 65.3 |
by Tom Moeller March 4, 2009
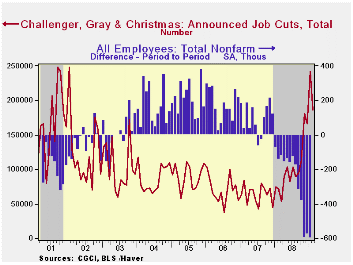
Challenger, Grey & Christmas reported that February job cut announcements eased slightly to 186,350 following 241,749 layoffs during January. Challenger also reported that announced hiring plans reversed much of the strong January gain.
Job cut announcements in the automotive sector surged to 61,288 and the financial business shed 13,550 jobs. Employment in the retail industry fell 18,759. Employment in the industrial goods industry again was quite weak and 19,462 jobs were lost while 3,960 were shed from the computer industry. From the pharmaceutical industry there were 8,806 layoffs and the electronics industry shed another 11,065 jobs
During the last ten years there has been a 67% (inverse) correlation between the three month moving average of announced job cuts and the three month change payroll employment.
Job cut announcements differ from layoffs. Many are achieved through attrition, early retirement or just never occur.
The Challenger figures are available in Haver's SURVEYS database.
The Term Structure of Inflation Expectations from the Federal Reserve Bank of New York is available here.
| Challenger, Gray & Christmas | February | January | Y/Y | 2008 | 2007 | 2006 |
|---|---|---|---|---|---|---|
| Announced Job Cuts | 186,350 | 241,749 | 158.5% | 1,223,993 | 768,264 | 839,822 |
by Robert Brusca March 4, 2009
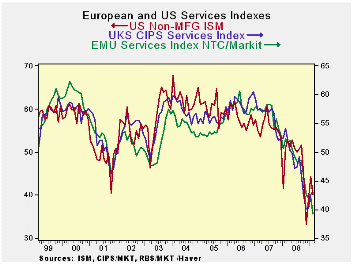
This trend is not a friend - In our select
group of EMU members (see table) all show month-to-month deterioration
in services activity. Meanwhile, the UK continues to cut losses
relative to its November low. The US follows a pattern somewhat like
the UK with its non-MFG index doing some backtracking in February but
still forming a series of months with a rising profile from a November
(2008) low.
Fate as her mistress - Europe is still slipping
lower, having just reached its cycle low in February. The tentative
evidence suggests that the US and UK are turning (or trying to turn a
corner) on the worst of times at least for their ‘Service’ sector. In
the US the situation is complicated by lumping the troubled housing
sector in with services as ‘non-MFG’.
The essential point here is that Europe is - as it usually is --
trailing the US by a few months. Typically it’s trailing by about six
months.
Masters of illusion - There was a brief period in
2006 when the US seemed to be lagging and Europe seemed to growing. At
that time Euro-pride was at its zenith. For a time the euro currency
ran to unprecedented heights on the view that Europe was special and
perhaps even bullet-proof. In time, that fallacy revealed itself as
sub-prime became the catalyst to expose all sorts of bad market
practices including excess lending to Eastern Europe explaining in part
the brief suspended animation for Europe from incipient US weakness.
But now it’s all out in the open and Europe and the US are part of the
same cyclical downturn. Notions of de-coupling are colder and deader
than Iceland’s balance sheet.
Europe continues to be beset with weakness from manufacturing
transmitted to services. The banking problems that Europe was initially
in denial about have simply taken a bit longer to emerge there, at
least in some respects. Remedy’s are in train, but so is more damage.
Old fashioned, anyone?
I find interesting the notion that the old fashioned business cycle is
back in play. The US is leading the cycle and Europe is following.
While some want to paint a picture of this cycle was something
unprecedented it is more like the 1973-75 and the 1981-82 cycles that
previously gripped the global economy. In 1977 the Economic Summit in
London failed to embrace a US-sponsored notion of a locomotive in which
stimulus across the G-7 would help bring world growth. By the Bonn
Summit in 1978 the G-7 was ready for this, but by then recovery had
started and Bonn only helped to inflation the recovery balloon beyond
its need. Against that patch of history this cycle is a bit more
understandable. Without any formal coordination we have a locomotive
process in train involving a US stimulus package various European
packages and large effort from a G-7 outsider, China. This is a
different version but it is more timely than what had been attempted in
1977/78. It is a good example of global enlightened self-interest.
The Bonn summit in 1978 declared:
‘We agreed on a comprehensive strategy covering growth, employment and
inflation, international monetary policy, energy, trade and other
issues of particular interest to developing countries. We must create
more jobs and fight inflation, strengthen international trading, reduce
payments imbalances, and achieve greater stability in exchange markets.
We are dealing with long term problems, which will only yield to
sustained efforts. This strategy is a coherent whole, whose parts are
interdependent. To this strategy, each of our countries can contribute;
from it, each can benefit.’
Not depression neglect but hybrid recession forces at work
- The actions this time around are not much different except that they
include a lot of help to a very battered global financial system. If
the efforts to patch up the financial system bear fruit I expect the
various efforts at stimulus to be successful. For the moment I see a
lot more comparisons with 1973-75 and 81-82 than with the great
depression everyone is so fond of speaking about. Without timely action
on the financial sector, a key part of the service sector, I might be
compelled to change my mind. But having the financial patches in play
is crucial to the outlook. Having them, it strikes me that the
developing recovery processes are much better understood in terms of
the recent history of economic summitry than by dredging up the
horrible depressing dillies from the days of Depression when various
federal safety nets were not available and the lessons from our
then-current folly had not been learned. This recession has late cycle
weakness as did 1973-75. But it also has the financial chaos
characteristic of 1981-82. (It is worse than that this time, but
similar to 1981-82.) Like 1973-75 it also has an oil trigger.
Bad summit/good summit - We may still employ summits
to try and get global attention to bear on this crisis. But what is
different this time is the willingness of countries to act
independently, yet in concert, without the need for a formal summit.
Yes, a summit still is coming. But it will likely not be that
successful. And this is because the leaders have learned to work
separately and with common purpose at the same time with a good measure
of success, taking pressure from the summit. Summits are too-grand and
too high-stakes, those factors ultimately constrain world economic
summit achievement. But summitry has undoubtedly brought the world
leaders closer, allowing them to think more alike as a global problem
emerges such as the one we are in the midst of trying to solve.
| NTC Services Indices for EU/EMU | |||||||
|---|---|---|---|---|---|---|---|
| Feb-09 | Jan-09 | Dec-08 | 3Mo | 6Mo | 12Mo | Percentile | |
| Euro-13 | 39.24 | 42.16 | 42.06 | 41.15 | 43.36 | 46.69 | 0.0% |
| Germany | 41.32 | 45.20 | 46.57 | 44.36 | 46.13 | 49.49 | 0.0% |
| France | 40.18 | 42.56 | 40.57 | 41.10 | 44.53 | 47.77 | 0.0% |
| Italy | 37.85 | 41.10 | 40.30 | 39.75 | 42.30 | 45.26 | 0.0% |
| Spain | 31.73 | 31.84 | 32.10 | 31.89 | 32.04 | 35.97 | 10.9% |
| Ireland | 31.78 | 33.94 | 34.14 | 33.29 | 34.89 | 39.14 | 0.0% |
| EU only | |||||||
| UK (CIPs) | 43.24 | 42.48 | 40.21 | 41.98 | 42.39 | 45.86 | 15.5% |
| US NONFMG ISM | 41.60 | 42.90 | 40.10 | 41.53 | 42.77 | 46.53 | 17.5% |
| EU Commission Indices for EU and EMU | |||||||
| EU Index | Feb-09 | Jan-09 | Dec-08 | 3Mo | 6Mo | 12Mo | Percentile |
| EU Services | -29 | -28 | -23 | -31.33 | -27.00 | -21.42 | 0.0% |
| EMU | Feb-09 | Jan-09 | Dec-08 | 3Mo | 6Mo | 12Mo | Percentile |
| Services | -23 | -22 | -17 | -20.67 | -13.50 | -5.42 | 0.0% |
| Cons Confidence | -33 | -31 | -30 | -31.33 | -27.00 | -10.75 | 0.0% |
| Consumer confidence by country | |||||||
| Germany | -29 | -27 | -22 | -26.00 | -19.00 | -11.67 | 0.0% |
| France | -36 | -35 | -34 | -35.00 | -31.67 | -25.58 | 0.0% |
| Ital | -28 | -26 | -30 | -28.00 | -25.83 | -24.58 | 6.3% |
| Spain | -48 | -44 | -46 | -46.00 | -44.17 | -37.83 | 0.0% |
| UK | -32 | -35 | -29 | -32.00 | -28.83 | -23.42 | 7.9% |
| percentile is over range since May 2000 | |||||||

Tom Moeller
AuthorMore in Author Profile »Prior to joining Haver Analytics in 2000, Mr. Moeller worked as the Economist at Chancellor Capital Management from 1985 to 1999. There, he developed comprehensive economic forecasts and interpreted economic data for equity and fixed income portfolio managers. Also at Chancellor, Mr. Moeller worked as an equity analyst and was responsible for researching and rating companies in the economically sensitive automobile and housing industries for investment in Chancellor’s equity portfolio. Prior to joining Chancellor, Mr. Moeller was an Economist at Citibank from 1979 to 1984. He also analyzed pricing behavior in the metals industry for the Council on Wage and Price Stability in Washington, D.C. In 1999, Mr. Moeller received the award for most accurate forecast from the Forecasters' Club of New York. From 1990 to 1992 he was President of the New York Association for Business Economists. Mr. Moeller earned an M.B.A. in Finance from Fordham University, where he graduated in 1987. He holds a Bachelor of Arts in Economics from George Washington University.
More Economy in Brief


