 Global| Oct 01 2008
ADP Report: Payroll Employment Decline Moderated
by:Tom Moeller
|in:Economy in Brief
Summary
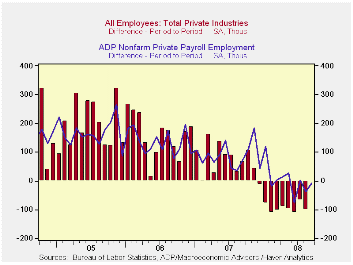
The payroll processor ADP released its National Employment Report for September. Private nonfarm payrolls were indicated to have fallen 8,000 after a downwardly revised 37,000 decline during August
The payroll processor ADP released its National Employment Report for September. Private nonfarm payrolls were indicated to have fallen 8,000 after a downwardly revised 37,000 decline during August
The U.S. Bureau of Labor Statistics will report on September payroll employment this Friday. Last month, the 37,000 worker decline in ADP's measure of private nonfarm payrolls was accompanied by a 101,000 worker decline in the BLS measure of private sector payrolls.According to ADP and Macro Advisers, the correlation between the monthly percentage change in the ADP estimate and that in the BLS data is 0.90.
Goods producing payrolls fell by 72,000 (-2.8% y/y). The
largest decline was amongst medium sized payrolls which fell 40,000
(-3.1% y/y) followed by a 16,000 (-1.5% y/y) drop in small sized
payrolls. Large payrolls fell 16,000 (-4.6% y/y).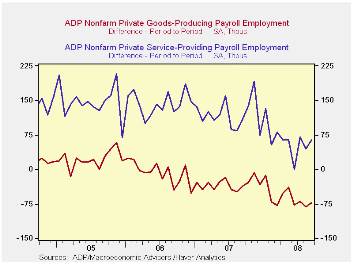
Employment in the service producing industry offset that weakness and rose by 64,000 (1.0% y/y). Small payrolls rose 44,000 (1.5% y/y) while medium sized payrolls increased 10,000 (1.0% y/y). Large service producing payrolls rose by 10,000 (-0.2% y/y), the most for any month since last November.
ADP compiled the estimate from its database of individual companies' payroll information. Macroeconomic Advisers, LLC, the St. Louis economic consulting firm, developed the methodology for transforming the raw data into an economic indicator.
The ADP National Employment Report data is maintained in Haver's
USECONdatabase; historical data go back to December 2000. The figures in this report cover only private sector jobs and exclude employment in the public sector, which rose an average 11,083 during the last twelve months.
The full ADP National Employment Report can be found here, and the ADP methodology is explained here.
| LAXEPA@USECON | September | August | Y/Y | 2007 | 2006 | 2005 |
|---|---|---|---|---|---|---|
| Nonfarm Private Payroll Employment (m/m Chg.) | -8,000 | -37,000 | 0.3% | 1.1% | 1.7% | 1.8% |
by Tom Moeller October 1, 2008
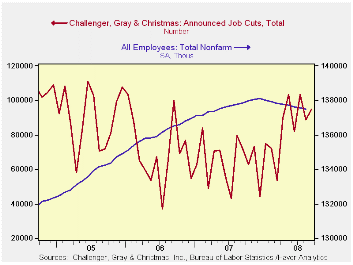
Job cut announcements rose 7.2% to 95,094 in September reversing half of their August decline, according to the Challenger, Grey & Christmas survey.
The three-month level layoffs also increased to 95,714 and was near the highest level since early 2006.
The rise in layoffs last month was led by a huge 25,221 rise in the computer industry and a 8,288 rise in the apparel industry. Declines in layoffs were registered in the automotive, electronics and in the industrial goods industries. Layoffs also fell in insurance industry and in the telecommunication businesses
During the last ten years there has been a 76% (inverse) correlation between the three-month moving average of announced job cuts and the three-month change payroll employment.
Job cut announcements differ from layoffs. Many are achieved through attrition, early retirement or just never occur.
Challenger also reported that announced hiring plans fell m/m and they were down 2.6% y/y.
| Challenger, Gray & Christmas | September | August | Y/Y | 2007 | 2006 | 2005 |
|---|---|---|---|---|---|---|
| Announced Job Cuts | 95,094 | 88,736 | 32.6% | 768,264 | 839,822 | 1,072,054 |
by Tom Moeller October 1, 2008
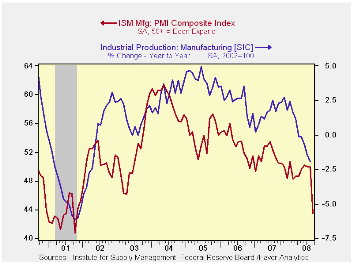
The Institute for Supply Management reported that it's Composite Index of Manufacturing Sector Activity plunged to its lowest level since the end of the 2001 recession. The decline to 43.5 in September from an August reading of 49.9 by far exceeded Consensus expectations for a roughly unchanged level of 49.5. The break-even level for this measure of factory sector activity is 50.
During the last twenty years there has been a 64% correlation between the level of the Composite Index and the three-month growth in factory sector industrial production.
It is appropriate to correlate the ISM index level with factory sector growth because the ISM index is a diffusion index. It measures growth by using all of the positive changes in activity added to one half of the zero change in activity measures.
The production sub-series led the decline in the composite
index with an 11.3 point drop to 40.8, the lowest level since early
1991.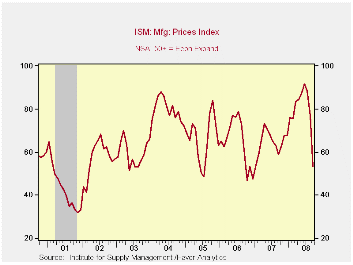
The new orders index followed closely and fell 9.5 points to 38.8. The new export orders sub-series held up, comparatively, and fell 5 points to a break-even level of 50. During the last ten years there has been a 53% correlation between the index and the q/q change in real exports of goods in the GDP accounts.
The employment index fell 7.9 points to 41.8, the lowest reading since early 2003. During the last twenty years there has been a 67% correlation between the level of the ISM employment index and the three-month growth in factory sector employment.
The inventories series fell to 43.4 and that reversed most of the August increase. Suppler deliveries rose slightly while order backlogs declined to their lowest level since early 2001.
Prices paid fell sharply, again. The index fell 23.5 points to 53.5 which was its lowest level since early 2007. That further reflected the recent decline in oil prices. During the last twenty years there has been a 79% correlation between the price index and the three-month change in the PPI for intermediate goods.
The Big Mac: A Global-to-Local Look at Pricing from the Federal Reserve Bank of Dallas is available here.
| ISM Mfg | September | August | September '07 | 2007 | 2006 | 2005 |
|---|---|---|---|---|---|---|
| Composite Index | 43.5 | 49.9 | 50.5 | 51.1 | 53.1 | 54.4 |
| New Orders Index | 38.8 | 48.3 | 53.6 | 54.3 | 55.4 | 57.4 |
| Employment Index | 41.8 | 49.7 | 51.5 | 50.5 | 51.7 | 53.6 |
| Prices Paid Index (NSA) | 53.5 | 77.0 | 59.0 | 64.6 | 65.0 | 66.4 |
by Tom Moeller October 1, 2008
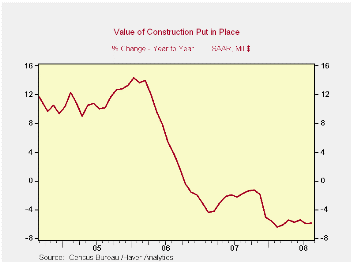
The value of construction put in place was unchanged during August but the decline in July was revised doubled to 1.4%. The decline for August compared to expectations for a slight, 0.5% drop.
Year-to-year, the decline in construction activity remained steady at a -5.9% pace, and the level of activity so far this year has been roughly stable.
The value of nonresidential building activity led the weakness
in building activity during August. It fell 0.8% after a downwardly
revised 1.1% drop during July. Several categories posted m/m declines,
notably transportation which fell 2.1% (+3.9% y/y). Commercial
construction fell 0.6% (-4.9% y/y) while spending on health care
facilities drpped again, during August by 0.8% (+4.9% y/y). Office
construction continued firm and increased 1.0% (10.6% y/y). Lodging
spending rose another 2.1% (29.3% y/y) while spending on multi-retail
building rose 2.7% (2.1% y/y).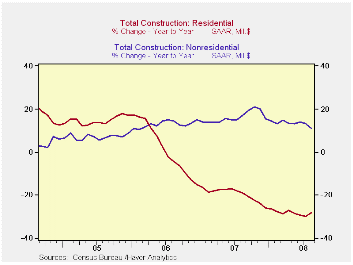
Residential building activity steadied after many months of sharp decline. The steadiness was due to a 9.8% (-8.4% y/y) jump in spending on home improvements. Single-family construction dropped another 4.2% (-41.1% y/y) and that level is off by two-thirds from its peak in early 2006. Building activity on multi-family units fell 4.2% (-4.3% y/y).
During the last twenty years there has been an 84% correlation between the q/q change in the value of residential building and its contribution to growth in real GDP.
Public construction continued firm and rose 0.8% (7.7% y/y). The value of construction spending on highways & streets recovered 3.9% (7.3% y/y). (The value of construction on highways & streets is roughly one third of the value of total public construction spending.) Building activity of office space was quite firm and rose 2.0% (24.7% y/y). Spending on health care facilities rose 7.3% (3.6% y/y).
The more detailed categories of construction represent the Census Bureau’s reclassification of construction activity into end-use groups. Finer detail is available for many of the categories; for instance, commercial construction is shown for automotive sales and parking facilities, drugstores, building supply stores, and both commercial warehouses and mini-storage facilities. Note that start dates vary for some seasonally adjusted line items in 2000 and 2002 and that constant-dollar data are no longer computed.
| Construction (%) | August | July | Y/Y | 2007 | 2006 | 2005 |
|---|---|---|---|---|---|---|
| Total | 0.0 | -1.4 | -5.9 | -2.7 | 6.3 | 11.2 |
| Private | -0.3 | -2.4 | -10.5 | -6.9 | 5.5 | 12.7 |
| Residential | 0.3 | -3.9 | -28.4 | -19.8 | 1.0 | 14.9 |
| Nonresidential | -0.8 | -1.1 | 13.0 | 19.6 | 16.2 | 7.8 |
| Public | 0.8 | 1.3 | 7.7 | 12.3 | 9.3 | 6.2 |
by Robert Brusca October 1, 2008
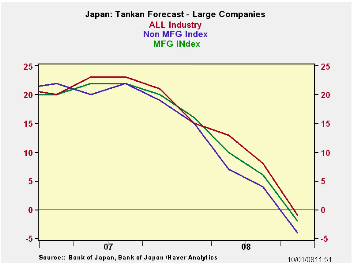
Japan’s tankan survey is very weak and showing a continuing
slide across the various size-class of respondents as well as across
industries. It is the LARGE company module of this survey that tends to
get the headlines. But the survey itself is rife with weakness even
outside of the big-company survey.
The Large company survey shows manufacturing, nonmanufaturing and the total industry indices at their range lows since early 2004. Large company industry readings all are at sample period lows except for construction and personal services (each in the lower 35% of their respective ranges) and for Restaurants & Hotels that are still very weak in the bottom 2.6% of their range.
The current period manufacturing index has an outright negative reading of -3. For nonmanufacturing the reading is a +1. The total industry reading is 0.
The outlook responses are at sample period lows for all sized classes of companies. In short it is a very weak Tankan that is both weak overall and across the board. Weakness is taking no prisoners.
| Tankan Results Large Enterprises | |||||||
|---|---|---|---|---|---|---|---|
| Readings | Averages | PERCENTILES | |||||
| Q3-08 | Q2-08 | Q1-08 | Q4-07 | 1-Y Avg | Since Q3'03 | Since Q1'04 | |
| MFG | -3.0 | 5.0 | 11.0 | 19.0 | 1.0 | 17.8 | 0.0% |
| NonMFG | 1.0 | 10.0 | 12.0 | 16.0 | 5.5 | 16.4 | 0.0% |
| Total Industry | 0.0 | 7.0 | 12.0 | 17.0 | 3.5 | 17.1 | 0.0% |
| Construction | -7.0 | -1.0 | -9.0 | -2.0 | -4.0 | -1.4 | 35.3% |
| Real Estate | 5.0 | 22.0 | 21.0 | 37.0 | 13.5 | 36.1 | 0.0% |
| Wholesale | 11.0 | 12.0 | 14.0 | 12.0 | 11.5 | 18.6 | 0.0% |
| Retail | -5.0 | 0.0 | 0.0 | 4.0 | -2.5 | 8.1 | 0.0% |
| Transportation | 6.0 | 16.0 | 17.0 | 14.0 | 11.0 | 16.8 | 0.0% |
| Services 4 Biz | 4.0 | 20.0 | 22.0 | 31.0 | 12.0 | 24.5 | 0.0% |
| Personal Service | 6.0 | 10.0 | 13.0 | 19.0 | 8.0 | 12.2 | 35.0% |
| Restaurants & Hotels | -13.0 | -14.0 | -3.0 | 12.0 | -13.5 | 7.6 | 2.6% |
| Forecast | |||||||
| Q4-08 | Q3-08 | Q2-08 | Q1-08 | 1-Y Avg | Since Q3'03 | Since Q1'04 | |
| MFG-Outlook | -4.0 | 4.0 | 7.0 | 15.0 | 5.5 | 16.0 | 0.0% |
| NonMFG-Outlook | -1.0 | 8.0 | 13.0 | 15.0 | 8.8 | 16.4 | 0.0% |
| All Industry-Outlook | -2.0 | 6.0 | 10.0 | 16.0 | 7.5 | 16.1 | 0.0% |
| Tankan Results Medium Enterprises | |||||||
| Q3-08 | Q2-08 | Q1-08 | 1-Y Avg | 1-Y Avg | Since Q3'03 | Since Q1'04 | |
| MFG | -8.0 | -2.0 | 5.0 | 1.3 | 1.3 | 8.8 | 0.0% |
| NonMFG | -12.0 | -5.0 | -3.0 | -4.5 | -4.5 | 1.2 | 0.0% |
| Forecast | |||||||
| Q4-08 | Q3-08 | Q2-08 | Q1-08 | 1-Y Avg | Since Q3'03 | Since Q1'04 | |
| MFG-Outlook | -12.0 | -5.0 | -1.0 | 6.0 | -3.0 | 6.4 | 0.0% |
| NonMFG-Outlook | -17.0 | -10.0 | -6.0 | -3.0 | -9.0 | 0.1 | 0.0% |
| All Industry-Outlook | -15.0 | -9.0 | -4.0 | 0.0 | -7.0 | 2.6 | 0.0% |
| Tankan Results Small Enterprises | |||||||
| Q4-08 | Q3-08 | Q2-08 | Q1-08 | 1-Y Avg | Since Q3'03 | Since Q1'04 | |
| MFG | -17.0 | -10.0 | -6.0 | -13.5 | -13.5 | 1.8 | 0.0% |
| NonMFG | -24.0 | -20.0 | -15.0 | -22.0 | -22.0 | -10.8 | 0.0% |
| Total Industry | -24.0 | -20.0 | -15.0 | -22.0 | -22.0 | -10.8 | 0.0% |
| Forecast | |||||||
| Q4-08 | Q3-08 | Q2-08 | Q1-08 | 1-Y Avg | Since Q3'03 | Since Q1'04 | |
| MFG-Outlook | -25.0 | -15.0 | -9.0 | -3.0 | -13.0 | 0.1 | 0.0% |
| NonMFG-Outlook | -31.0 | -27.0 | -21.0 | -17.0 | -24.0 | -14.1 | 0.0% |
| All Industry-Outlook | -29.0 | -22.0 | -17.0 | -12.0 | -20.0 | -8.9 | 0.0% |
by Robert Brusca October 1, 2008
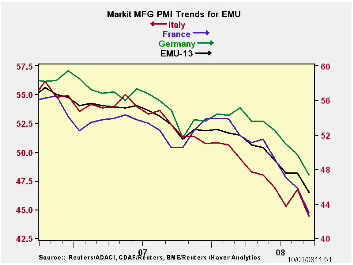
The PMI details for the e-Zone and the UK makes for dismal reading. After a widespread but small rebound in August the various indices all are lower in September. All readings are below the 50% mark except for Greece. The overall EMU reading resides in the bottom 13% of its range of values since early 2000. Germany is relatively stronger in its 30th percentile, awhile France resides in its 4th percentile. The UK is at its weakest point for that same period.
Slow growth and financial turmoil have been slow to grip the e-Zone or at least slow to be revealed. Overnight VDMA’s engineering orders for Germany posted another drop and the UK services sector came up dead flat in Q3. Surprisingly retail sales in Germany rose sharply after two months of drops and auto sales in France rose. Overall the EMU unemployment rate did edge up although Germany has continued to show the number of unemployed still dropping.
There is little in the way of truly mixed data for Europe. For the most part it is simply weak and getting weaker. The spots of strength in the data today seem to be counter point anomalies. With so much weakness elsewhere in key reports as well as in the day’s MFG report from Markit, EMU seems clearly and firmly on the path to economic contraction.
| NTC MFG Indices | |||||||
|---|---|---|---|---|---|---|---|
| Sep-08 | Aug-08 | Jul-08 | 3Mo | 6Mo | 12Mo | Percentile* | |
| Euro Area | 44.97 | 47.55 | 47.38 | 46.63 | 48.40 | 50.37 | 12.1% |
| Germany | 47.36 | 49.68 | 50.90 | 49.31 | 51.28 | 52.55 | 30.5% |
| France | 42.97 | 45.79 | 47.05 | 45.27 | 47.94 | 50.35 | 4.2% |
| Italy | 44.42 | 46.77 | 45.32 | 45.50 | 46.62 | 48.67 | 7.4% |
| Spain | 38.32 | 42.40 | 39.20 | 39.97 | 41.59 | 45.19 | 0.0% |
| Austria | 46.01 | 48.61 | 46.97 | 47.20 | 48.26 | 50.87 | 17.3% |
| Greece | 50.79 | 52.46 | 51.63 | 51.63 | 52.81 | 52.97 | 33.1% |
| Ireland | 43.70 | 44.88 | 43.39 | 43.99 | 44.43 | 46.91 | 2.5% |
| Netherlands | 48.30 | 49.82 | 47.99 | 48.70 | 50.02 | 51.94 | 33.6% |
| European Union | |||||||
| UK | 40.97 | 45.33 | 44.11 | 43.47 | 45.95 | 49.05 | 0.0% |
| *Percentile is over range since March 2000 | |||||||

Tom Moeller
AuthorMore in Author Profile »Prior to joining Haver Analytics in 2000, Mr. Moeller worked as the Economist at Chancellor Capital Management from 1985 to 1999. There, he developed comprehensive economic forecasts and interpreted economic data for equity and fixed income portfolio managers. Also at Chancellor, Mr. Moeller worked as an equity analyst and was responsible for researching and rating companies in the economically sensitive automobile and housing industries for investment in Chancellor’s equity portfolio. Prior to joining Chancellor, Mr. Moeller was an Economist at Citibank from 1979 to 1984. He also analyzed pricing behavior in the metals industry for the Council on Wage and Price Stability in Washington, D.C. In 1999, Mr. Moeller received the award for most accurate forecast from the Forecasters' Club of New York. From 1990 to 1992 he was President of the New York Association for Business Economists. Mr. Moeller earned an M.B.A. in Finance from Fordham University, where he graduated in 1987. He holds a Bachelor of Arts in Economics from George Washington University.
More Economy in Brief


