 Global| May 05 2010
ADP Report: Job Growth Resumes Led By The Service & Factory Sectors
by:Tom Moeller
|in:Economy in Brief
Summary
Positive growth in the number of jobs has returned. The latest report from the payroll processor ADP, in their National Employment Report, indicated that private nonfarm payroll levels rose in April by 32,000, the third consecutive [...]
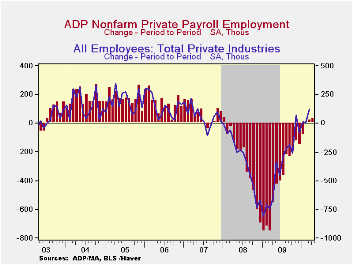
Positive growth in the number of jobs has returned. The latest report from the payroll processor ADP, in their National Employment Report, indicated that private nonfarm payroll levels rose in April by 32,000, the third consecutive month of increase. The gain roughly matched Consensus expectations. Earlier data were slightly revised.
ADP compiled the estimate from its database of individual companies' payroll information. Macroeconomic Advisers, LLC, the St. Louis economic consulting firm, developed the methodology for transforming the raw data into an economic indicator.
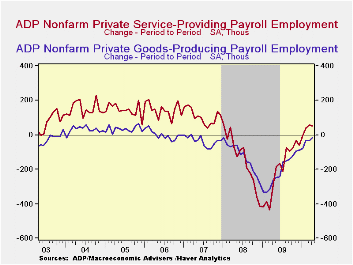
The U.S. Bureau of Labor Statistics will report April payroll employment this Friday. For comparison, the March increase of 19,000 in ADP's measure of private nonfarm payrolls was accompanied by a rise of 123,000 jobs in the BLS measure of private sector payrolls. According to ADP and Macro-Advisers, the correlation between the monthly percentage change in the ADP estimate and that in the BLS data is 0.90.ADP reported that private service-producing industry employment rose for the third consecutive month with a gain of 50,000 (-0.8% y/y). Small-sized payrolls grew 25,000 (-0.6% y/y) while medium-sized payrolls grew 20,000 (-0.9% y/y). These increases were accompanied by a modest 5,000 increase (-1.5% y/y) in large service producing payrolls.
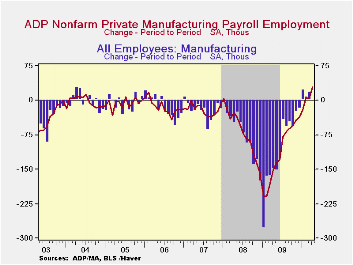
Though declines in the goods producing sector have lessened, employment nevertheless fell another 18,000 during April (-7.4% y/y). The three-month annual rate of change eased to -2.0% versus -17.1% one year ago. In the manufacturing sector alone, however, payrolls rose 29,000 (-4.9% y/y). The three-month change of 1.3% was the first positive figure since early-2006. Large goods producing payrolls increased 9,000 (-7.6% y/y), the first positive change in more than two years. Small-sized payrolls fell 24,000 (-8.4% y/y) while medium-sized payrolls fell 3,000 (-6.5% y/y).
| ADP National Employment Report | April | March | February | Y/Y | 2009 | 2008 | 2007 |
|---|---|---|---|---|---|---|---|
| Total Nonfarm Private Payroll Employment (m/m Chg., 000s) | 32 | 19 | 3 | 2.0% | -4.9% | -0.7% | 1.1% |
| Small Payroll (1-49) | 1 | 4 | -10 | -1.7 | -4.1 | -0.1 | 1.8 |
| Medium Payroll (50-499) | 17 | 12 | 17 | -2.0 | -5.7 | -0.9 | 1.0 |
| Large Payroll (>500) | 14 | 3 | -4 | -2.8 | -5.6 | -1.8 | -0.2 |
by Robert Brusca May 05, 2010
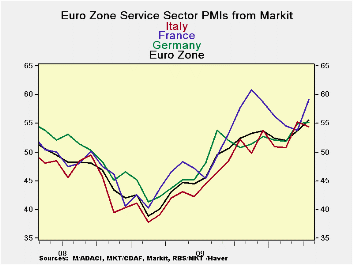
The services sector continues to improve in EMU with the EMU and German indices rising in April to their strongest levels since late in 2007 (France was last stronger in Nov of 2009; Italy’s index slipped in April).
While Germany and the overall EMU measures continue to rise strongly some countries in the Zone are slowing their progress, as the French and Italian comparisons show. The services sector is still where the jobs are and this sector is not as vibrant as the manufacturing sector.
The Euro-Area retail sales for April were flat in volume terms and barley higher Yr/Yr. The consumer sector has just not come alive in Europe and that is a key part of the services sector.
Looking ahead there will be challenges to Europe’s service sector. The ash cloud that shut down air transportation has just shut down a few more airports in Scotland. Those interruptions will probably affect services, especially tourism. Greece which is a hot tourism destination will have been off limits to most tourists during the time of its upheaval. And, since Greece is in the Zone there is no such thing as a post crisis ‘drachma discount.’ Indeed, with strikes still in progress in Greece there is no telling how much the tourists season will harmed as we head into summer.
| Markit Services Indices for EU/EMU | |||||||
|---|---|---|---|---|---|---|---|
| Apr-10 | Mar-10 | Feb-10 | 3Mo | 6Mo | 12Mo | Percentile | |
| Euro-Area | 55.60 | 54.08 | 51.81 | 53.83 | 53.44 | 50.77 | 76.4% |
| Germany | 55.22 | 54.86 | 51.89 | 53.99 | 53.04 | 51.11 | 70.7% |
| France | 59.17 | 53.80 | 54.60 | 55.86 | 57.23 | 53.72 | 85.0% |
| Italy | 54.47 | 55.34 | 50.76 | 53.52 | 52.53 | 49.35 | 69.3% |
| Spain | 50.93 | 51.27 | 47.12 | 49.77 | 48.21 | 45.82 | 70.6% |
| Ireland | 51.02 | 49.61 | 48.84 | 49.82 | 48.15 | 46.05 | 56.0% |
| EU only | |||||||
| UK (CIPs) | #N/A | 56.46 | 58.41 | #N/A | #N/A | #N/A | #N/A |
| EU Commission Indices for EU and EMU | |||||||
| EU Index | Apr-10 | Mar-10 | Feb-10 | 3Mo | 6Mo | 12Mo | Percentile |
| EU Services | 4 | 1 | 0 | -16.33 | -16.33 | -19.42 | 54.3% |
| EMU | Apr-10 | Mar-10 | Feb-10 | 3Mo | 6Mo | 12Mo | Percentile |
| Services | 5 | 1 | 1 | 2.33 | -0.17 | -8.21 | 55.6% |
| Cons Confidence | -15 | -17 | -17 | -16.33 | -16.33 | -11.94 | 54.3% |
| Consumer confidence by country | |||||||
| Germany-Ccon | -7 | -13 | -17 | -12.33 | -15.00 | -19.58 | 60.5% |
| France-Ccon | -20 | -19 | -17 | -18.67 | -18.00 | -22.75 | 42.5% |
| Ital-Ccon | -21 | -22 | -22 | -21.67 | -19.17 | -18.75 | 31.4% |
| UK-Ccon | -6 | -5 | -2 | -4.33 | -6.00 | -10.42 | 76.3% |
| percentile is over range since May 2000 | |||||||
by Tom Moeller May 5,2010
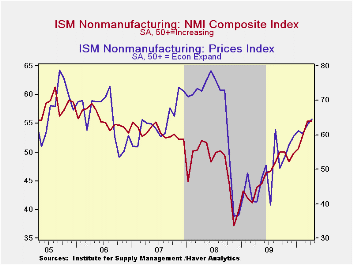
Recovery in the service sector continued last month. The Institute for Supply Management's (ISM) Composite Index for the service & construction sectors held steady in April at 55.4, the highest level since early-2006. Moreover, the series has risen considerably from a low of 37.2 late in 2008. The latest figure fell slightly short of Consensus expectations for a reading of 56.0. Since the series' inception in 1997 there has been a 65% correlation between the level of the composite index in the nonmanufacturing sector and the q/q change in real GDP for the services and the construction sectors.
ISM surveys more than 370 purchasing managers in more than 62 industries including law firms, hospitals, government and retailers. The nonmanufacturing survey dates back to July 1997. The figures are available in Haver's USECON database.
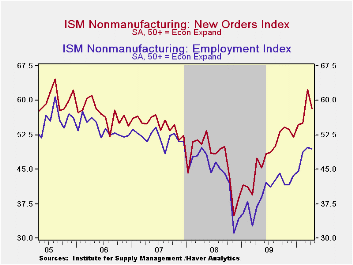
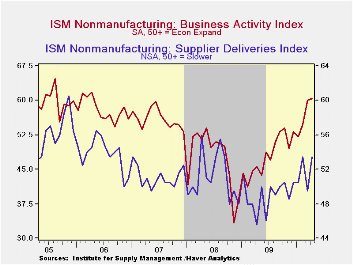
The business activity index for the nonmanufacturing sector nudged up to 60.3 which was the highest level since early-2006. The supplier delivery index also rose indicating slower delivery speeds. Working the other way, the new orders index retraced a piece of its March surge but remained near the highest level since 2006. Thirty-six percent of respondents reported higher orders while only 11% reported them lower. Finally, the employment index also slipped from the highest level since April 2008 and remained up sharply from the late-2008 low. Since the series' inception in 1997 there has been an 80% correlation between the level of the ISM nonmanufacturing employment index and the m/m change in payroll employment in the service-producing plus the construction industries.
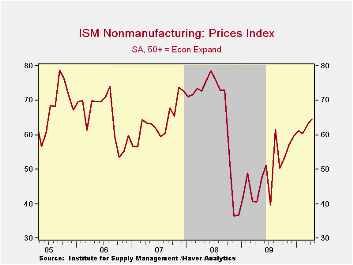
Pricing power continued to firm. At its strongest since September 2008, the index at 64.7 was up sharply from the 2008 low. Forty-two percent of respondents reported higher prices while just 2% reported them lower. At the worst, late in 2008, 41% reported lower prices. Since its inception ten years ago, there has been a 73% correlation between the price index and the q/q change in the GDP services chain price index.
| ISM Nonmanufacturing Survey | April | March | February | April '09 | 2009 | 2008 | 2007 |
|---|---|---|---|---|---|---|---|
| Composite Index | 55.4 | 55.4 | 53.0 | 43.9 | 46.2 | 47.3 | 53.5 |
| Business Activity | 60.3 | 60.0 | 54.8 | 45.7 | 48.0 | 47.4 | 56.0 |
| New Orders | 58.2 | 62.3 | 55.0 | 47.4 | 47.9 | 47.0 | 54.8 |
| Employment | 49.5 | 49.8 | 48.6 | 36.9 | 39.9 | 43.8 | 52.0 |
| Supplier Deliveries (NSA) | 53.5 | 49.5 | 53.5 | 45.5 | 49.0 | 51.1 | 51.1 |
| Prices Index | 64.7 | 62.9 | 60.4 | 40.6 | 49.4 | 66.0 | 63.8 |
by Tom Moeller May 5, 2010
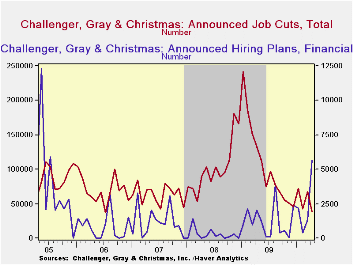
The outplacement firm Challenger, Grey & Christmas reported that the level of layoffs fell last month to 38,326. It was the lowest level since mid-2006 and remained well under the cycle-high of 241,748 in January of last year. The decline was led by sharply lower layoffs in the government, computer, energy, entertainment, and retail industries. An increased level of layoffs occurred in the construction, financial, health care and utility industries.
Challenger also samples firms' hiring plans. April plans increased for the second month consecutive month to the highest level since 2005. They rose in the transportation, consumer goods, health care and financial industries though most elsewhere they fell.
During the last ten years there has been a 67% (inverse) correlation between the three-month moving average of announced job cuts and the three-month change in payroll employment. Job cut announcements differ from layoffs. Many are achieved through attrition, early retirement or just never occur.
The Challenger figures are available in Haver's SURVEYS database.
| Challenger, Gray & Christmas | April | March | February | Y/Y | 2009 | 2008 | 2007 |
|---|---|---|---|---|---|---|---|
| Announced Job Cuts | 38,326 | 67,611 | 42,090 | -71.1% | 1,288,030 | 1,223,993 | 768,264 |
| Announced Hiring Plans | 15,654 | 13,994 | 8,300 | -42.2% | 272,573 | 118,600 | 365,583 |

Tom Moeller
AuthorMore in Author Profile »Prior to joining Haver Analytics in 2000, Mr. Moeller worked as the Economist at Chancellor Capital Management from 1985 to 1999. There, he developed comprehensive economic forecasts and interpreted economic data for equity and fixed income portfolio managers. Also at Chancellor, Mr. Moeller worked as an equity analyst and was responsible for researching and rating companies in the economically sensitive automobile and housing industries for investment in Chancellor’s equity portfolio. Prior to joining Chancellor, Mr. Moeller was an Economist at Citibank from 1979 to 1984. He also analyzed pricing behavior in the metals industry for the Council on Wage and Price Stability in Washington, D.C. In 1999, Mr. Moeller received the award for most accurate forecast from the Forecasters' Club of New York. From 1990 to 1992 he was President of the New York Association for Business Economists. Mr. Moeller earned an M.B.A. in Finance from Fordham University, where he graduated in 1987. He holds a Bachelor of Arts in Economics from George Washington University.
More Economy in Brief


