 Global| Oct 19 2009
Actual Exchange Rates in the Developing World and Purchasing Power Parity
Summary
While purchasing power parity (PPP) is not a major factor in determining a country's actual exchange rate, it can be used as a rough guide in deciding whether a particular currency is under or over valued. Most developing countries [...]
 While
purchasing power parity (PPP) is not a major factor in determining a
country's actual exchange rate, it can be used as a rough guide in
deciding whether a particular currency is under or over
valued. Most developing countries with growing
current account balances, have preferred to pile up foreign exchange
reserves rather than let their currencies appreciate.
Meanwhile, the purchasing power parity of their currencies has
generally increased slowly and steadily as their economies have
prospered. As a result their currencies have continued to be
undervalued.
While
purchasing power parity (PPP) is not a major factor in determining a
country's actual exchange rate, it can be used as a rough guide in
deciding whether a particular currency is under or over
valued. Most developing countries with growing
current account balances, have preferred to pile up foreign exchange
reserves rather than let their currencies appreciate.
Meanwhile, the purchasing power parity of their currencies has
generally increased slowly and steadily as their economies have
prospered. As a result their currencies have continued to be
undervalued.
Data on the purchasing power parity of currencies can be
derived from data in the Haver data base, The World
Development Indicators. 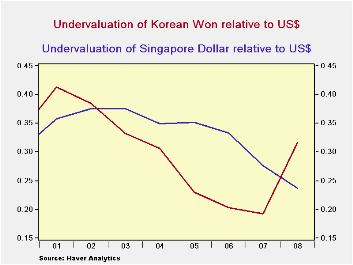 The data are annual so the
latest data point is 2008. PPP conversion factors for the
world countries are included in the section "Exchange Rates and
Prices". We chose four countries as examples:
China, Korea, Singapore and Brazil and the PPP Conversion
Factor (GDP) to market exchange rate ratio.
The data are annual so the
latest data point is 2008. PPP conversion factors for the
world countries are included in the section "Exchange Rates and
Prices". We chose four countries as examples:
China, Korea, Singapore and Brazil and the PPP Conversion
Factor (GDP) to market exchange rate ratio.
The conversion
factor is the ratio of PPP exchange rate to the actual exchange rate.
One minus the conversion factor, therefore is the percentage of under
or over valuation of the particular exchange rate relative to the
dollar. Thus for Korea, the conversion factor of
.684 in 2008 means that the Korea's actual exchange rate was 31.6%
undervalued relative to the dollar. 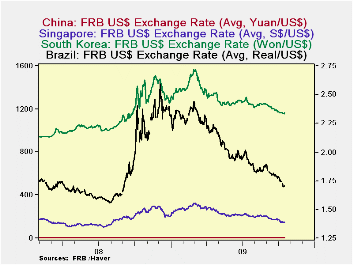 Since the actual exchange
rate is 1102.09 Won/$, a conversion factor of .684 means that the PPP
exchange rate is 753.98 Won/$ (.684 * 1102.09). The actual
exchange rates, the PPP exchange rates and the percent of
undervaluation of the currencies of the four countries are shown in the
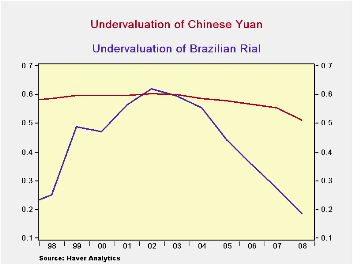
table below.· Brazil has allowed its currency to appreciate
considerably. From an undervaluation of 61.9 in 2002, the
Rial was only 18.4% undervalued in 2008, as shown in the first
chart. By contrast, China has permitted only moderate
appreciation of the yuan as shown in the same chart. The Singapore
dollar has steadily reduced its undervaluation as can be seen in the
second chart. Korea, on the other hand experienced a sharp
increase in its undervaluation in 2008, also shown in the second
chart.
Since the actual exchange
rate is 1102.09 Won/$, a conversion factor of .684 means that the PPP
exchange rate is 753.98 Won/$ (.684 * 1102.09). The actual
exchange rates, the PPP exchange rates and the percent of
undervaluation of the currencies of the four countries are shown in the
table below.· Brazil has allowed its currency to appreciate
considerably. From an undervaluation of 61.9 in 2002, the
Rial was only 18.4% undervalued in 2008, as shown in the first
chart. By contrast, China has permitted only moderate
appreciation of the yuan as shown in the same chart. The Singapore
dollar has steadily reduced its undervaluation as can be seen in the
second chart. Korea, on the other hand experienced a sharp
increase in its undervaluation in 2008, also shown in the second
chart.
The third chart brings up to date the actual exchange
rates of the four countries. They have, to varying degrees,
appreciated in 2009. Again, the Chinese Yuan has appreciated
the least and the Brazilian Real, the most.
| 2008 | 2007 | 2006 | 2005 | 2004 | 2003 | 2002 | |
|---|---|---|---|---|---|---|---|
| China | |||||||
| Actual exchange rate (Yuan/$) | 6.95 | 7.61 | 7.97 | 8.19 | 8.28 | 8.28 | 8.28 |
| PPP exchange rate | 3.39 | 3.38 | 3.46 | 3.45 | 3.43 | 3.29 | 3.28 |
| Undervaluation (%) (1-Conversion factor) | 51.1 | 55.5 | 56.6 | 57.9 | 58.6 | 60.1 | 60.3 |
| Korea | |||||||
| Actual exchange rate (Won/$) | 1102.1 | 929.3 | 954.8 | 1024.1 | 1145.3 | 1191.1 | 1251.1 |
| PPP exchange rate | 754.0 | 747.9 | 760.7 | 788.9 | 794.3 | 795.7 | 769.8 |
| Undervaluation (%) (1-Conversion factor) | 31.5 | 19.3 | 20.3 | 23.0 | 30.7 | 32.2 | 38.5 |
| Singapore | |||||||
| Actual exchange rate (S$/US$) | 1.41 | 1.51 | 1.59 | 1.66 | 1.69 | 1.74 | 1.79 |
| PPP exchange rate | 1.08 | 1.09 | 1.06 | 1.08 | 1.10 | 1.09 | 1.12 |
| Undervaluation (%) (1-Conversion factor) | 23.7 | 27.7 | 33.3 | 35.7 | 34.9 | 37.6 | 37.5 |
| Brazil | |||||||
| Actual exchange rate (Rial/$) | 1.83 | 1.94 | 2.18 | 2.43 | 2.93 | 3.08 | 2.93 |
| PPP exchange rate | 1.50 | 1.41 | 1.40 | 1.36 | 1.31 | 1.22 | 1.11 |
| Undervaluation (%) (1Conversion factor) | 18.4 | 27.6 | 35.8 | 44.2 | 55.3 | 57.6 | 61.9 |
More Economy in Brief


