 Global| Feb 28 2003
4Q GDP Growth Revised Up
by:Tom Moeller
|in:Economy in Brief
Summary
Real GDP growth last quarter was revised up unexpectedly. Consensus expectations were for a revision to 1.0% growth. The surprise was that domestic demand growth was stronger than initially estimated. Growth in final sales to domestic [...]
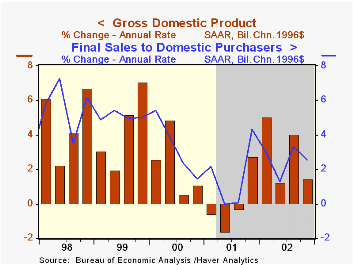
Real GDP growth last quarter was revised up unexpectedly. Consensus expectations were for a revision to 1.0% growth. The surprise was that domestic demand growth was stronger than initially estimated.
Growth in final sales to domestic purchasers was revised up to 2.5% due to broad based upward revisions. Growth in personal consumption expenditures was raised to 2.6% from 1.0% reported initially due to higher estimates for spending on nondurables and services.
Growth in residential investment was revised up to 9.4% (6.7% y/y) from 6.9%.
Capital spending growth was revised up to 2.5% from 1.5%. Business spending on structures was revised to a deeper decline but growth in spending on equipment and software was raised to 6.5% from 5.0%. Spending growth for information processing equipment & software was left about unchanged at 3.4% (9.1% y/y), up for the fourth consecutive quarter.
A raised rate of inventory accumulation added to GDP growth for the fourth consecutive quarter.
The trade sector's negative contribution to growth was doubled. The decline in exports was revised to 4.5% (+4.3% y/y) from -1.7%. Import growth of 7.2% (10.1% y/y) was about double the initial estimate.
Inflation was revised little and the strongest since 1Q02.
| Chained '96 $, % AR | 4Q'02 (Prelim.) | 4Q'02 Advance) | 3Q'02 (Final) | Y/Y | 2002 | 2001 | 2000 |
|---|---|---|---|---|---|---|---|
| GDP | 1.4% | 0.7% | 4.0% | 2.9% | 2.4% | 0.3% | 3.8% |
| Inventory Effect | 0.2% | -0.6% | 0.6% | 1.2% | 0.6% | -1.2% | 0.1% |
| Final Sales | 1.2% | 1.3% | 3.4% | 1.7% | 1.8% | 1.5% | 3.7% |
| Trade Effect | -1.4% | -0.7% | -0.0% | -0.8% | -0.5% | -0.1% | -0.6% |
| Domestic Final Demand | 2.5% | 1.9% | 3.3% | 2.5% | 2.4% | 1.6% | 4.3% |
| Chained GDP Price Deflator | 1.6% | 1.7% | 1.0% | 1.3% | 1.1% | 2.4% | 2.1% |
by Tom Moeller February 28, 2003
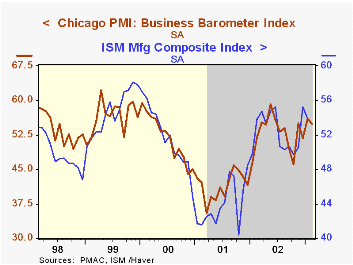
The Chicago Purchasing Manager’s Index of Business activity fell less than expected in February. Consensus estimates were for a reading of 53.5.
The modest drop contrasted with the much sharper declines reported in the Empire State and Philadelphia Fed surveys for February.
Over the last ten years there has been an 86% correlation between the Chicago PMI and the ISM Composite Index, to be released on Monday.
The indexes of new orders and employment rose, but production fell.
The prices paid index rose modestly but remained well below recent peaks.
Visit the Chicago Purchasing Managers website at www.napm-chicago.org.
| Chicago Purchasing Managers Index, SA | Feb | Jan | Y/Y | 2002 | 2001 | 2000 |
|---|---|---|---|---|---|---|
| Business Barometer | 54.9 | 56.0 | 51.8 | 52.7 | 41.4 | 51.8 |
| Prices Paid | 54.9 | 54.2 | 49.8 | 56.9 | 50.4 | 65.6 |
by Tom Moeller February 28, 2003
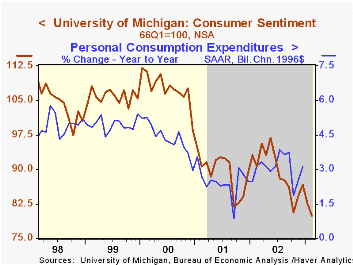
The February reading of Consumer Sentiment from the University of Michigan fell 3.0% from January. The figure was about in-line with Consensus expectations for a reading of 79.2.
The moderate decline in Sentiment contrasts with the much sharper 18.8% plunge in Consumer Confidence reported earlier this week.
The index of current conditions and expectations both fell moderately.
Over the last 10 years there has been a 62% correlation between the level of consumer sentiment and the y/y change in real PCE. That correlation rose to 82% during the last five years.
The University of Michigan survey is not seasonally adjusted.
| University of Michigan | Feb | Jan | Y/Y | 2002 | 2001 | 2000 |
|---|---|---|---|---|---|---|
| Consumer Sentiment | 79.9 | 82.4 | -11.9% | 89.6 | 89.2 | 107.6 |
by Tom Moeller February 28, 2003
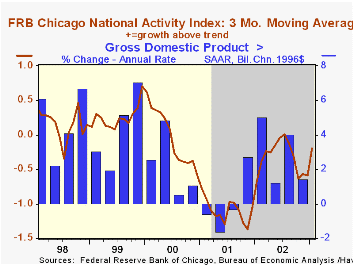
The Chicago Fed National Activity Index (CFNAI) improved last month to the first positive reading since last July.
The improvement pulled the three-month moving average of the CFNAI to -0.19, the highest since August and consistent with roughly 3-4% growth in real GDP.. A zero value of the CFNAI indicates that the economy is expanding at its historical trend rate of growth.
During the last ten years there has been a 72% correlation between the level of the CFNAI and quarterly growth in real GDP.
The CFNAI is a weighted average of 85 indicators of economic activity. The indicators reflect activity in the following categories: production & income, the labor market, personal consumption & housing, mfg. & trade sales, and inventories & orders.
For a complete discussion of the latest Chicago Fed's National Activity Index click here.
A discussion of the CFNAI and its role as a business cycle indicator can be found here.
| Chicago Fed | Jan | Dec | Jan '02 | 2002 | 2001 | 2000 |
|---|---|---|---|---|---|---|
| CFNAI | 0.38 | -0.62 | 0.04 | -0.29 | -1.13 | -0.16 |

Tom Moeller
AuthorMore in Author Profile »Prior to joining Haver Analytics in 2000, Mr. Moeller worked as the Economist at Chancellor Capital Management from 1985 to 1999. There, he developed comprehensive economic forecasts and interpreted economic data for equity and fixed income portfolio managers. Also at Chancellor, Mr. Moeller worked as an equity analyst and was responsible for researching and rating companies in the economically sensitive automobile and housing industries for investment in Chancellor’s equity portfolio. Prior to joining Chancellor, Mr. Moeller was an Economist at Citibank from 1979 to 1984. He also analyzed pricing behavior in the metals industry for the Council on Wage and Price Stability in Washington, D.C. In 1999, Mr. Moeller received the award for most accurate forecast from the Forecasters' Club of New York. From 1990 to 1992 he was President of the New York Association for Business Economists. Mr. Moeller earned an M.B.A. in Finance from Fordham University, where he graduated in 1987. He holds a Bachelor of Arts in Economics from George Washington University.
More Economy in Brief


