 Global| Sep 06 2006
2Q U.S. Productivity Revised Up, Compensation Surged
by:Tom Moeller
|in:Economy in Brief
Summary
Non-farm labor productivity growth last quarter was revised upward to 1.6%, about as expected. The gain remained, however, quite a bit slower than the 2.7% average quarterly growth during the prior four quarters. Compensation growth [...]
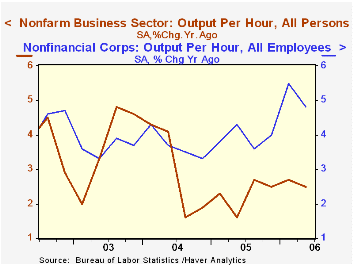
Non-farm labor productivity growth last quarter was revised upward to 1.6%, about as expected. The gain remained, however, quite a bit slower than the 2.7% average quarterly growth during the prior four quarters.
Compensation growth also was revised up, but to a much greater degree. The revised 6.6% 2Q increase compared to a preliminary report of a 5.4% gain and the revised 13.7% surge during 1Q was more than double the initial report.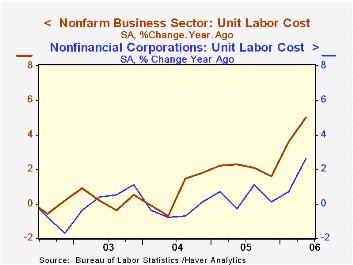
Unit labor costs, therefore, surged. The revised 2Q increase of 4.9% was up from the initial report of a 4.2% gain and the 9.0% increase now estimated for 1Q compares to a 2.5% increase reported last month.
Factory sector productivity growth was revised down slightly to 2.6% (3.7% y/y) after a 3.7% 1Q increase. Factory sector compensation per hour, however, was revised up to a 4.0% (6.1% y/y) gain from 1.7%.
The previous sense that unit labor costs in the factory sector were under control, therefore, was revised away. Costs rose 1.3% (2.4% y/y) after a 9.3% 1Q rise that was revised from 1.4%.
In the nonfinancial corporate sector 2Q productivity, reported for the first time, grew 2.2% (4.8% y/y) after an 11.1% surge during 1Q. Unit labor costs grew 4.2% (2.6% y/y), the most since 3Q '05.
Do Inflation Targeters Outperform Non-targeters? from the Federal Reserve Bank of St. Louis is available here.
| Non-farm Business Sector (SAAR) | 2Q' 06 (Revised) | 1Q '06 | Y/Y | 2005 | 2004 | 2003 |
|---|---|---|---|---|---|---|
| Output per Hour | 1.6% | 4.3% | 2.5% | 2.3% | 3.0% | 3.7% |
| Compensation per Hour | 6.6% | 13.7% | 7.7% | 4.4% | 3.6% | 4.0% |
| Unit Labor Costs | 4.9% | 9.0% | 5.0% | 2.0% | 0.7% | 0.3% |
by Tom Moeller September 6, 2006
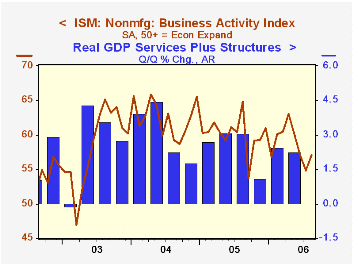
The August Business Activity Index for the non-manufacturing sector from the Institute for Supply Management (ISM) improved to 57.0 and exceeded Consensus expectations for stability near 55.0.
Since the series' inception in 1997 there has been a 50% correlation between the level of the Business Activity Index and the q/q change in real GDP for services plus construction.
The new orders sub-index fell for the fourth consecutive month to the lowest level in three years while the employment index also fell to its lowest level since January. Since the series' inception in 1997 there has been a 60% correlation between the level of the ISM non-manufacturing employment index and the m/m change in payroll employment in the service producing plus the construction industries.
Pricing power fell for the second month in the last three and was somewhat below the 2Q average. Since inception eight years ago, there has been a 70% correlation between the price index and the y/y change in the GDP services chain price index.
ISM surveys more than 370 purchasing managers in more than 62 industries including construction, law firms, hospitals, government and retailers. The non-manufacturing survey dates back to July 1997. Business Activity Index for the non-manufacturing sector reflects a question separate from the subgroups mentioned above. In contrast, the NAPM manufacturing sector composite index is a weighted average five components.Barreling Down the Road to Recession? from the Federal Reserve Bank of St. Louis can be found here.
| ISM Nonmanufacturing Survey | Aug | July | Aug '05 | 2005 | 2004 | 2003 |
|---|---|---|---|---|---|---|
| Business Activity Index | 57.0 | 54.8 | 64.8 | 60.1 | 62.5 | 58.3 |
| Prices Index | 72.4 | 74.8 | 67.2 | 67.9 | 68.8 | 56.6 |
by Tom Moeller September 6, 2006
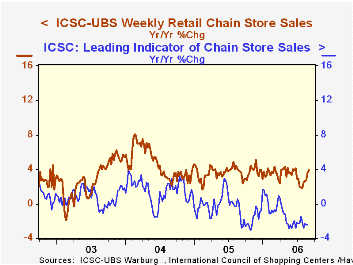
The International Council of Shopping Centers (ICSC)-UBS survey indicated that chain store sales rose another 0.3% last week after the 0.6% increase at the end of August.
The gains were the first back to back weekly increases in a month and lifted sales in early September 0.6% above the August average which rose 0.4% from July. During the last ten years there has been a 47% correlation between the y/y change in chain store sales and the change in nonauto retail sales less gasoline.The ICSC-UBS retail chain-store sales index is constructed using the same-store sales (stores open for one year) reported by 78 stores of seven retailers: Dayton Hudson, Federated, Kmart, May, J.C. Penney, Sears and Wal-Mart.
The leading indicator of chain store sales from ICSC-UBS slipped another 0.1% (-2.5% y/y) in the latest week.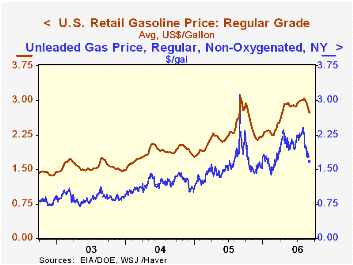 The retail price for a gallon of regular unleaded gasoline dropped a sharp twelve cents to an average $2.73 (-11.1% y/y), the lowest level since early April. In spot market trading yesterday, regular unleaded gasoline prices fell again to $1.67, down twelve cents from last week's average.
Oil prices also fell with the spot price of WTI crude down to $68.61 per bbl. (+4.0% y/y). Natural gas prices similarly fell to $5.49/mmbtu (-52.6% y/y) in spot trading.
The retail price for a gallon of regular unleaded gasoline dropped a sharp twelve cents to an average $2.73 (-11.1% y/y), the lowest level since early April. In spot market trading yesterday, regular unleaded gasoline prices fell again to $1.67, down twelve cents from last week's average.
Oil prices also fell with the spot price of WTI crude down to $68.61 per bbl. (+4.0% y/y). Natural gas prices similarly fell to $5.49/mmbtu (-52.6% y/y) in spot trading.
The latest Short-Term Energy Outlook from the U.S. Energy Information Administration is available here.
| ICSC-UBS (SA, 1977=100) | 09/02/06 | 08/26/06 | Y/Y | 2005 | 2004 | 2003 |
|---|---|---|---|---|---|---|
| Total Weekly Chain Store Sales | 473.2 | 471.7 | 3.9% | 3.6% | 4.7% | 2.9% |
by Tom Moeller September 6, 2006
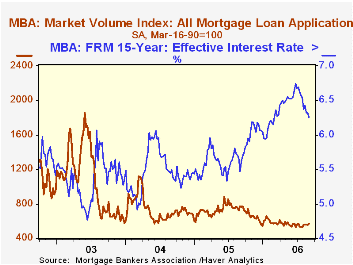
The total number of mortgage applications recovered 1.8% last week, according to the Mortgage Bankers Association, after a 0.9% decline at the end of August. The gain lifted the opening September level 1.5% versus the August average which rose 2.9% from July.
A 3.7% w/w increase in purchase applications followed several weeks of decline and lifted applications 1.7% above the August average which fell 3.5% from July.
During the last ten years there has been a 58% correlation between the y/y change in purchase applications and the change in new plus existing single family home sales.
Applications to refinance slipped 0.9%.
The effective interest rate on a conventional 30-year mortgage fell to 6.53% from 6.60% the prior week. The peak for 30 year financing was 7.08% late in June. The rate on 15-year financing also fell to 6.25% and the peak rate was 6.75%. Interest rates on 15 and 30 year mortgages are closely correlated (>90%) with the rate on 10 year Treasury securities.
During the last ten years there has been a (negative) 79% correlation between the level of applications for purchase and the effective interest rate on a 30-year mortgage.
The Mortgage Bankers Association surveys between 20 to 35 of the top lenders in the U.S. housing industry to derive its refinance, purchase and market indexes. The weekly survey accounts for more than 40% of all applications processed each week by mortgage lenders. Visit the Mortgage Bankers Association site here.
| MBA Mortgage Applications (3/16/90=100) | 09/01/06 | 08/25/06 | Y/Y | 2005 | 2004 | 2003 |
|---|---|---|---|---|---|---|
| Total Market Index | 566.3 | 556.5 | -26.6% | 708.6 | 735.1 | 1,067.9 |
| Purchase | 389.7 | 375.9 | -21.9% | 470.9 | 454.5 | 395.1 |
| Refinancing | 1,594.7 | 1,609.2 | -26.4% | 2,092.3 | 2,366.8 | 4,981.8 |
by Carol Stone September 6, 2006
There's a nip of autumn in the air in the New York region, and that change in the weather begins to shift our attention from the price of gasoline to heating fuel costs. Haver has three new databases that help us assess "how much it costs to produce heat" and many other energy questions. Coming from Energy Intelligence, a leading oil industry consulting firm, Oil Market Intelligence (OMI), Natural Gas Week (NGW) and World Gas Intelligence (WGI) contain extensive price, supply, demand and stock data for several energy sources in the US and around the world.
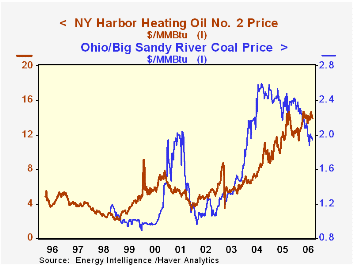
For instance, we can compare the cost of various fuels on a common basis, since NGW and WGI contain prices expressed in both the unit each fuel is commonly sold in, as well as in millions of Btu of energy produced. Last week, WTI Cushing crude was priced at $70.54/barrel and $12.16 per million Btu, and heating oil at the New York harbor was $1.9312/gallon and $13.92/MMBtu. By contrast, coal from Big Sandy River, Ohio, was $46.50 a ton, which translates into $1.94/MMBtu.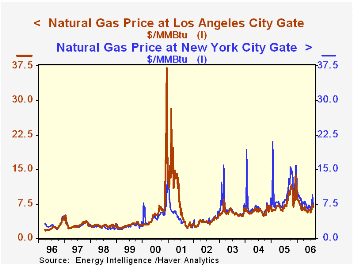
These databases also facilitate comparisons across geographic markets. So in the winter of 2000/2001, we can quickly see how distorted the natural gas market was in California. As evident from the second graph, the New York "City Gate" price was about $4.50/MMBtu in late summer and peaked over the New Year in a range of $10-$16. It has shown seasonal spikes during the winter in most other years. However, in California, there looks to be only the mildest of seasonal swings then, as one might surmise from the temperate climate there. Except in 2001. In August 2000, the price was $5 to $6. In December it was $26, reaching a peak of $37.12 in the third week of December and remaining above $10/MMBtu until early May. A casual observer [in truth, someone just now passing by my desk] remarked, "my, what was wrong in LA that winter!" Lots. Similarly, it's easy to see the impact of Hurricanes Katrina and Rita in 2005.
The frequencies of these data vary, with some daily, some weekly and some monthly. Coverage of Europe is quite detailed, and supply and demand information on Asia is extensive. These databases, well established in the industry, should be very useful to Haver clients.
| Selected Fuel Prices prices, $ | 9/4/06 | 8/28/06 | July 2006 | Aug 2005 | 2005 | 2004 | 2003 |
|---|---|---|---|---|---|---|---|
| Heating Oil: New York Harbor, $/bbl |
1.9312 | 1.9764 | 1.9270 | 1.7059 | 1.6109 | 1.1089 | 0.8418 |
| $/MMBtu | 13.92 | 14.25 | 13.89 | 12.30 | 11.82 | 8.05 | 6.13 |
| Natural Gas: New York City Gate, $/MMBtu |
5.92 | 7.72 | 6.85 | 9.54 | 10.01 | 6.78 | 6.41 |
| Natural Gas: Los Angeles City Gate, $/MMBtu |
-- | 6.81 | 6.22 | 8.04 | 7.93 | 5.93 | 5.61 |
| Coal: Sandy River, Ohio, $/ton |
46.50 | 47.25 | 46.85 | 57.05 | 56.26 | 54.56 | 32.96 |
| $/MMBtu | 1.94 | 1.97 | 1.95 | 2.40 | 2.38 | 2.28 | 1.38 |

Tom Moeller
AuthorMore in Author Profile »Prior to joining Haver Analytics in 2000, Mr. Moeller worked as the Economist at Chancellor Capital Management from 1985 to 1999. There, he developed comprehensive economic forecasts and interpreted economic data for equity and fixed income portfolio managers. Also at Chancellor, Mr. Moeller worked as an equity analyst and was responsible for researching and rating companies in the economically sensitive automobile and housing industries for investment in Chancellor’s equity portfolio. Prior to joining Chancellor, Mr. Moeller was an Economist at Citibank from 1979 to 1984. He also analyzed pricing behavior in the metals industry for the Council on Wage and Price Stability in Washington, D.C. In 1999, Mr. Moeller received the award for most accurate forecast from the Forecasters' Club of New York. From 1990 to 1992 he was President of the New York Association for Business Economists. Mr. Moeller earned an M.B.A. in Finance from Fordham University, where he graduated in 1987. He holds a Bachelor of Arts in Economics from George Washington University.
More Economy in Brief


