 Global| Jul 30 2004
2Q GDP Growth Slowed, Inflation Up
by:Tom Moeller
|in:Economy in Brief
Summary
US real GDP growth in 2Q slowed sharply to 3.0% from the upwardly revised estimate of 4.5% growth 1Q. Consensus estimates had been for 3.7% growth last quarter. Figures back to 1Q 2001 were revised. Price inflation at 3.2% was [...]
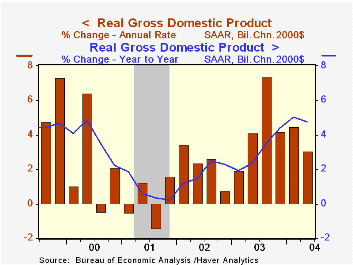
US real GDP growth in 2Q slowed sharply to 3.0% from the upwardly revised estimate of 4.5% growth 1Q. Consensus estimates had been for 3.7% growth last quarter. Figures back to 1Q 2001 were revised.
Price inflation at 3.2% was slightly higher than expectations for a 3.0% gain. The PCE chain price index, up 3.3%, rose the same as in 1Q but investment price inflation rose. Business equipment & software prices rose 0.2% (0.1% y/y) versus the 1.1% 1Q decline. Residential investment prices also picked up to 7.0% (5.3% y/y).Less food & energy the GDP chain price index rose 2.6% (1.9% y/y) after a 2.3% rise in 1Q.
Growth in total domestic final demand slowed to 2.7% from 3.9% in 1Q. Sharply slower growth in consumer spending was the culprit behind the 2Q growth slowdown. Real PCE grew at just a 1.0% rate versus 4.1% 1Q growth. Spending on motor vehicles & parts fell (for the third straight quarter), nondurables goods spending slipped on lower clothing purchases and services spending slowed.
Inventory investment also contributed much less to GDP growth, just a quarter of its contribution in 1Q.
Fixed investment spending actually picked up with the growth in business fixed investment more than doubling versus 1Q to 8.8% (9.9% y/y). Equipment & software spending rose at a 10.0% rate (12.8% y/y) and structures spending rose for the second quarter in the last three. Residential investment growth tripled to 15.4% (12.9% y/y).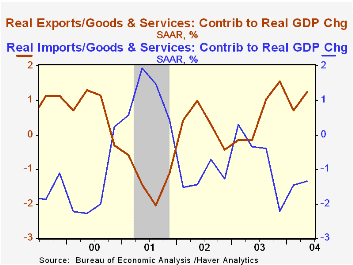
The trade sector subtracted a marginal 0.1 percentage points from 2Q GDP growth. The trade sector has been progressively subtracting less from GDP growth versus huge negative contributions from 1997 to 2002 due to accelerated growth in exports. Exports grew at an 18.4% rate (16.2% y/y) last quarter versus 13.4% 1Q growth and declines in 2001 & 2002. Imports grew at a 9.3% rate (9.9% y/y), also more than double the growth of the prior two years.
The Federal Reserve Board's latest Beige Book on US economic activity can be found here.
"What Impact Will E-Commerce Have on the U.S. Economy?" from the Federal Reserve Bank of Kansas City can be found here.
| Chained 2000$, % AR | 2Q '04 (Advance) | 1Q '04 (Revised) | Y/Y | 2003 | 2002 | 2001 |
| GDP | 3.0% | 4.5% | 4.8% | 3.0% | 1.9% | 0.8% |
| Inventory Effect | 0.3% | 1.2% | 0.7% | -0.1% | 0.5% | -0.8% |
| Final Sales | 2.8% | 3.3% | 4.1% | 3.1% | 1.4% | 1.6% |
| Trade Effect | -0.1% | -0.8% | -0.1% | -0.3% | -0.7% | -0.2% |
| Domestic Final Demand | 2.7% | 3.9% | 4.2% | 3.4% | 2.1% | 1.8% |
| Chained GDP Price Index | 3.2% | 2.8% | 2.3% | 1.8% | 1.7% | 2.4% |
| Chained 2000$, % AR | 2Q '04 (Advance) |
1Q '04 (Revised) |
Y/Y | 2003 | 2002 | 2001 |
|---|---|---|---|---|---|---|
| GDP | 3.0% | 4.5% | 4.8% | 3.0% | 1.9% | 0.8% |
| Inventory Effect | 0.3% | 1.2% | 0.7% | -0.1% | 0.5% | -0.8% |
| Final Sales | 2.8% | 3.3% | 4.1% | 3.1% | 1.4% | 1.6% |
| Trade Effect | -0.1% | -0.8% | -0.1% | -0.3% | -0.7% | -0.2% |
| Domestic Final Demand | 2.7% | 3.9% | 4.2% | 3.4% | 2.1% | 1.8% |
| Chained GDP Price Index | 3.2% | 2.8% | 2.3% | 1.8% | 1.7% | 2.4% |
by Tom Moeller July 30, 2004
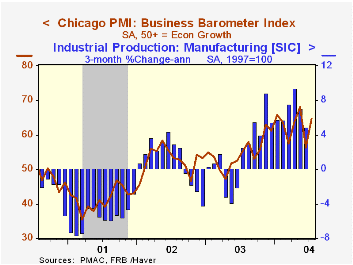
The July Chicago Purchasing Managers Business Barometer recovered most of its June decline with an 8.3 point rise to 64.7. Consensus expectations had been for a lesser rise to 60.0.
During the last ten years there has been a 74% correlation between the level of the Chicago Business Barometer and three month growth in factory sector industrial output.
The new orders index surged 11.9 points to 68.7 after the 17.6 point drop in June. Production made up almost all of its June skid with a 15.6 point surge to 69.5.
The employment index dropped sharply to 45.6, the lowest level in a year and an indication that job growth stopped. During the last twenty years there has been an 80% correlation between the level of this employment index and the three month change in factory sector employment.
The index of prices paid eased to 77.6, the lowest in three months.
| Chicago Purchasing Managers Index, SA | July | June | July '03 | 2003 | 2002 | 2001 |
|---|---|---|---|---|---|---|
| Business Barometer | 64.7 | 56.4 | 55.3 | 54.7 | 52.7 | 41.4 |
| New Orders | 68.7 | 56.8 | 61.0 | 58.0 | 56.2 | 42.3 |
| Prices Paid | 77.6 | 84.5 | 48.3 | 55.8 | 56.9 | 50.4 |
by Tom Moeller July 30, 2004
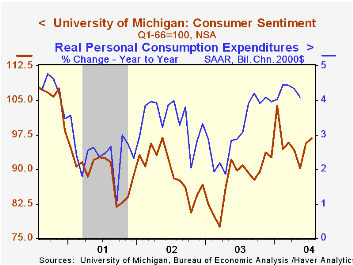
The University of Michigan’s consumer sentiment index for July improved to 96.7 versus the mid-month read of 96.0 and from95.6 in June. Consensus expectations had been for 96.0.
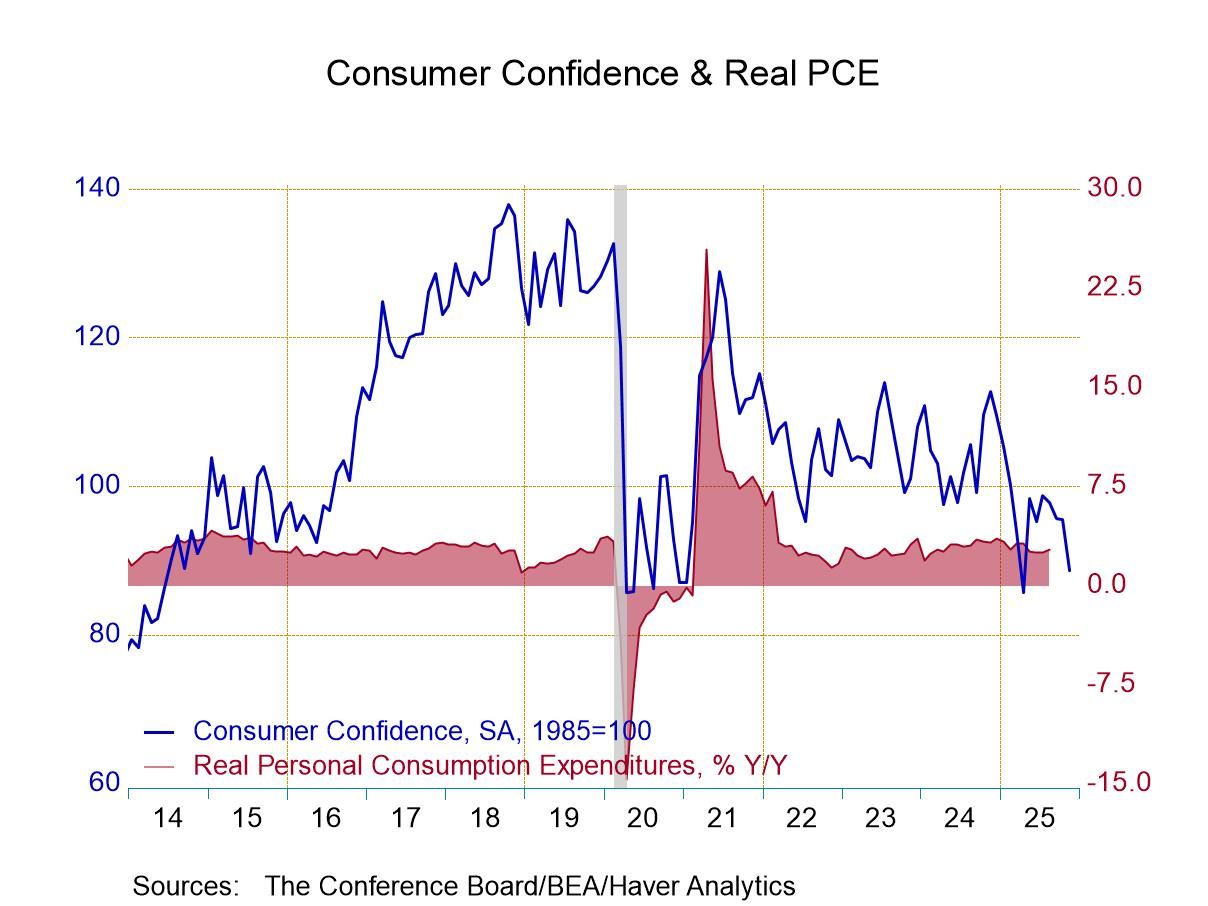
During the last ten years there has been a 75% correlation between the level of consumer sentiment and the y/y change in real PCE.
The expectations sub-index rose to 91.2 versus 90.4 mid-month and 88.5 in June. The index of current economic conditions at 105.2 was a lesser 1.4% decline versus June than the 2.0% dip reported mid-month.
The University of Michigan survey is not seasonally adjusted.The mid-month survey is based on telephone interviews with 250 households nationwide on personal finances and business and buying conditions. The survey is expanded to a total of 500 interviews at month end.
| University of Michigan | July | June | Y/Y | 2003 | 2002 | 2001 |
|---|---|---|---|---|---|---|
| Consumer Sentiment | 96.7 | 95.6 | 6.4% | 87.6 | 89.6 | 89.2 |
| Current Conditions | 105.2 | 106.7 | 3.0% | 97.2 | 97.5 | 100.1 |
| Consumer Expectations | 91.2 | 88.5 | 9.0% | 81.4 | 84.6 | 82.3 |
by Tom Moeller July 30, 2004
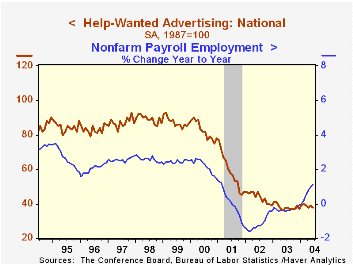
The Conference Board’s National Index of Help-Wanted Advertising remained stalled last month. At 38 the figure was off slightly from 39 in May and about where it's been for over a year.
During the last ten years there has been a 91% correlation between the level of help-wanted advertising and the year-to-year change in non-farm payrolls.
The proportion of labor markets with rising want-ad volume dropped sharply to 31% from 75% in May.
The Conference Board surveys help-wanted advertising volume in 51 major newspapers across the country every month.
| Conference Board | June | May | June '03 |
|---|---|---|---|
| National Help Wanted Index | 38 | 39 | 38 |
Tom Moeller
AuthorMore in Author Profile »Prior to joining Haver Analytics in 2000, Mr. Moeller worked as the Economist at Chancellor Capital Management from 1985 to 1999. There, he developed comprehensive economic forecasts and interpreted economic data for equity and fixed income portfolio managers. Also at Chancellor, Mr. Moeller worked as an equity analyst and was responsible for researching and rating companies in the economically sensitive automobile and housing industries for investment in Chancellor’s equity portfolio. Prior to joining Chancellor, Mr. Moeller was an Economist at Citibank from 1979 to 1984. He also analyzed pricing behavior in the metals industry for the Council on Wage and Price Stability in Washington, D.C. In 1999, Mr. Moeller received the award for most accurate forecast from the Forecasters' Club of New York. From 1990 to 1992 he was President of the New York Association for Business Economists. Mr. Moeller earned an M.B.A. in Finance from Fordham University, where he graduated in 1987. He holds a Bachelor of Arts in Economics from George Washington University.


