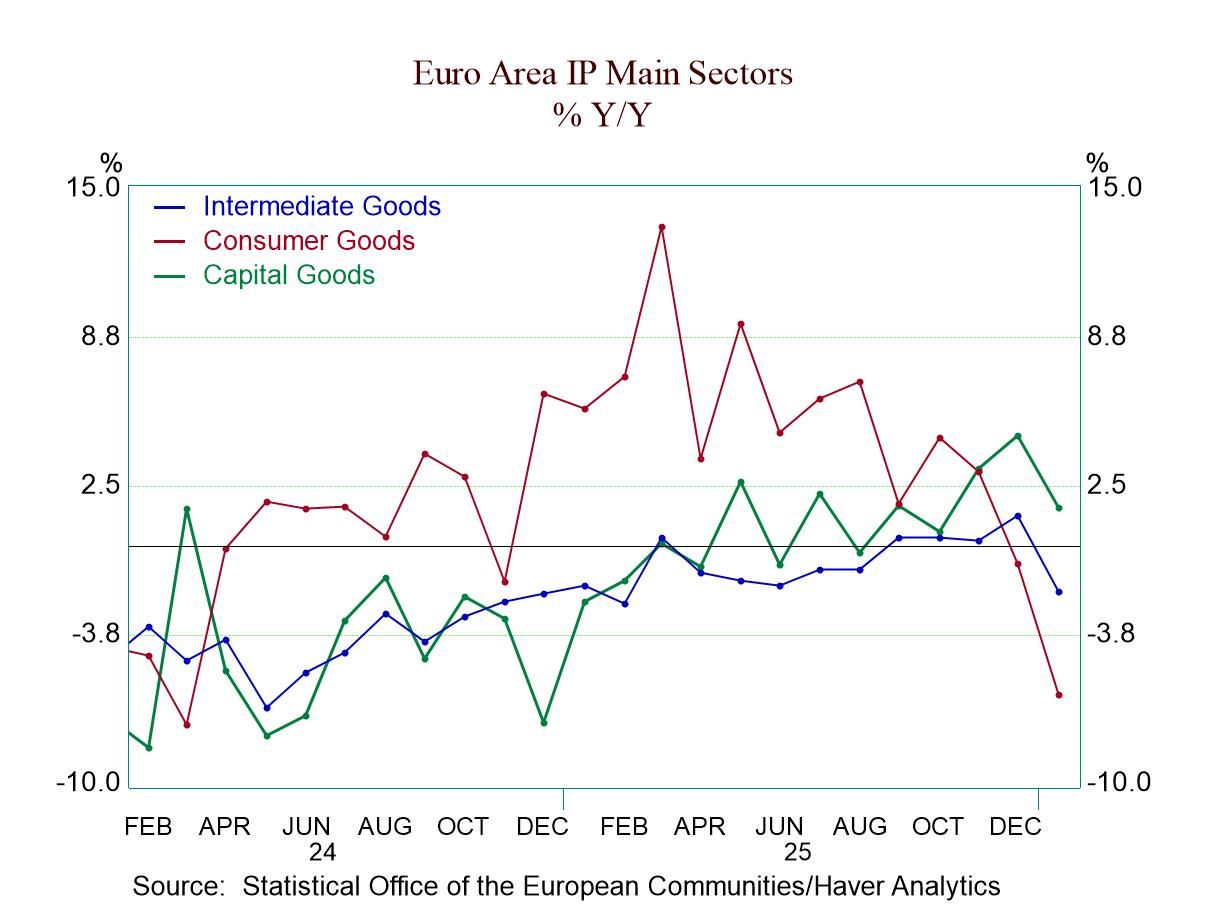
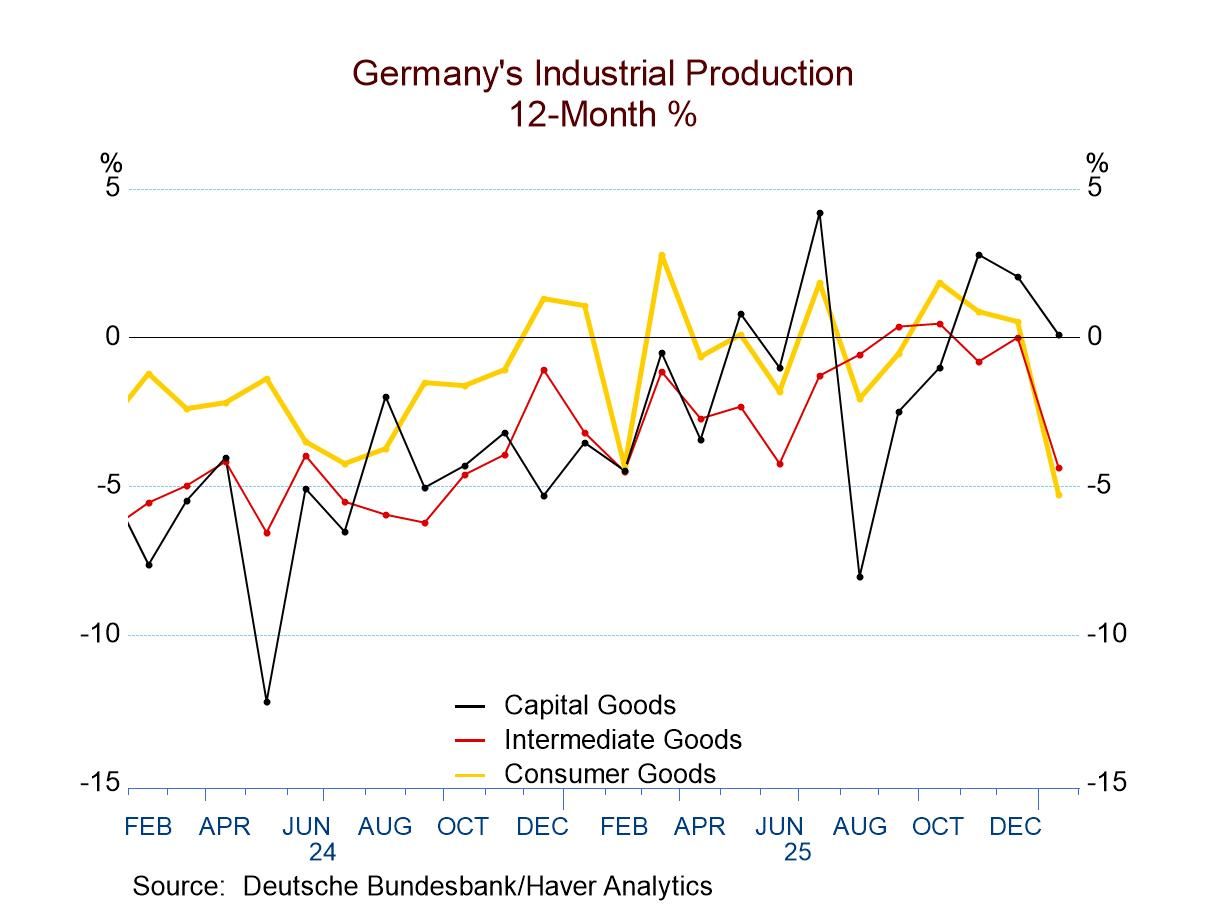
Haver Analytics
Haver Analytics

Introducing

Robert Brusca

Robert A. Brusca is Chief Economist of Fact and Opinion Economics, a consulting firm he founded in Manhattan. He has been an economist on Wall Street for over 25 years. He has visited central banking and large institutional clients in over 30 countries in his career as an economist. Mr. Brusca was a Divisional Research Chief at the Federal Reserve Bank of NY (Chief of the International Financial markets Division), a Fed Watcher at Irving Trust and Chief Economist at Nikko Securities International. He is widely quoted and appears in various media.   Mr. Brusca holds an MA and Ph.D. in economics from Michigan State University and a BA in Economics from the University of Michigan. His research pursues his strong interests in non aligned policy economics as well as international economics. FAO Economics’ research targets investors to assist them in making better investment decisions in stocks, bonds and in a variety of international assets. The company does not manage money and has no conflicts in giving economic advice.

Publications by Robert Brusca

  • The plot of the economy watchers readings since mid-2024 paints a pretty clear picture of the performance of the economy according to this metric. The chart shows the summary. The future conditions index, the current conditions index, and the reading for current conditions employment, have all been below diffusion values of 50 on a fairly steady basis. In addition, there has been little tendency for trend to take hold; there appears to be some modest up trending going on from early-2024 to later in the year. However, more recently we see some backfilling in terms of that progress. All told it's hard to make too much out of these readings other than to note that diffusion values have been slightly below 50, indicating slight deterioration in current conditions, in the employment market, and for expected future conditions. The results are not draconian. It's really just been a period of slight underperformance by the economy and for expectations for the future and in terms of the job market.

    December Current Index In December, among the nine component readings for the current index, four of them produced diffusion values above 50, indicating some net expansion. Corporate nonmanufacturers registered 50.5, the household sector generated a rating of 50.2, retailing came in at 50.4, while the services sector produced the highest reading at 51.1. All of these are readings very close to 50 and are not showing much in the way of growth. But being above 50, they are signaling some small net expansion. The contracting side of the ledger in December shows eating and drinking places with the diffusion value of 46.9, housing at 46.5, corporate manufacturers at 47.2, the overall corporate reading at 49.1, and the employment reading at 49.7. The current reading is an echo of the performance of the headlines plotted in the chart at the top, indicating a close clustering around the value of 50. There are a few sector readings with diffusion values slightly above 50 and a few with readings below 50. However, over 12 months we have net declines for all of the readings except for housing and for retailing.

    Diffusion ratings pertain to month-to-month activity comparisons while the queue standings describe the December diffusion index ranked among its historic data on a longer timeline back to 2002. The ranking data put a slightly different spin on events because the current index, which is at 49.9, showing the barest decline in terms of the diffusion index, also has a queue standing at 69.6% which tells us that over this span the index has been stronger only about 30% of the time. A modest contraction is actually significantly stronger reading than Japan has been used to seeing over this 20-plus year period. Looking at the rankings across the components, we find only two have a percentile standing below their 50%-mark, employment at 29.2% along with corporate manufacturers at 47.8%.

    December Future Index The future index has a diffusion reading of 48.8; that shows a weakening compared to November's reading at 49.4. In December only two components have readings above the 50th percentile, services at 52.8 and nonmanufacturing corporations at 50.1; the latter is as bare bones a reading above 50 as possible. The remaining readings are below 50 indicating net contractions. The lowest being housing at 44.5, with three readings in the 47-diffusion range for corporate manufacturers, for eating and drinking establishments, and for retailing. As we saw with the current index, the 12-month change in the future index also shows a drop in the headline of 1.6 points with drops logged across most components with an increase only in nonmanufacturing corporations and an unchanged reading for retailing.

    Queue percentile standings are weaker for the future index than for the current index. Its standing is only at 51.4% for the headline with four components having readings below the 50% mark, but for the most part, significantly below the 50% mark corporate manufacturers have a percentile standing at 45.1%, eating and drinking places have a ranking at 41.5%, housing has a ranking at 40.7%, and on the outlook for employment there is a reading at 30%.

    On balance, the economy watchers index does not indicate much change in Japan's economy in December. The outlook deteriorates slightly from November, but it's still roughly unchanged in its diffusion value showing only slight deterioration; that continues to be the overall picture just as for the current index where deterioration continues to be the picture despite some reduction in the pace of slowing this month. The queue standings, however, show that the current index is posting numbers that are relatively firmer compared to what they've been over the last 20 years or so. The future index is much more modestly positioned compared to its historic readings.

  • Global| Jan 13 2025

    OECD LEIs Creep Ahead

    The OECD seven-country LEI rose in December and is gaining at an annual rate of 1.1% over three months, up marginally from a pace of 0.9% over six months and doubling its growth rate over 12 months. Still, all of these are modest numbers. Japan’s LEI was flat in December and shows LEI declines over three months, six months and 12-months. The U.S. shows a gain of 0.2% in December with a 1.8% annual rate rise over three months, a 1.3% pace over six months and the same 0.5% gain year-over-year as for the OECD7. The index levels show an OECD7 queue standing in its 66.8 percentile, the U.S. a tad stronger at its 68.2 percentile and Japan much weaker and below tis median pace at a 36-percentile standing.

    The OECD likes to judge these indicators over six months. So, I construct six-month averages, and we see the same 0.4% U.S. and OECD7 gains on this average for its change month-to-month in December and November for both. Japan turns up flat in December on this metric and shows declines over three months and 12 months. In contrast, China shows declines on this averaged gauge in December and in November but shows growing momentum from 12-months to 6-months to 3-months. The 6-month growth rate show strength in the rankings for the U.S., China, and the OECD7. But Japan also sputters in terms of growth rates on 6-month changes with a 36-percentile standing.

    The amplitude adjusted metrics show only France persistently with a reading below 100 - but Japan walks the line. The ratio to six months ago shows only Japan and Germany weakening. The queue standings show only Japan and Germany, with readings below their respective medians (values below 50%).

    The OECD data are not very reassuring. While conditions show basic advancing trends, they are advancing slowly with little evidence of strength. The U.S. has the strongest standing on OECD index levels and growth rates, and they are largely in the 68th and 81st percentile ranges. Germany and Japan sport 36-percentile standings for their LEI index levels on amplitude adjusted readings. These are very weak reading for two important economies.

  • French retail sales volumes fell by 0.1% in November after falling by 0.1% in October; July was the last month to produce a month-to-month increase in retail sales volumes. In July 2024, those volumes increased by 0.2%. Sales volume trends in France continue to be weak.

    Year-over-year growth rates for all products show a 0.1% decline in volume which has a 51.7 percentile rank on data back to mid-2007. Among the various categories, food purchases have a sub-50-percentile ranking as do electronics and the sales of new autos. These sub-50-percentile rankings indicate that the current year-over-year growth rates are below the median growth rate for year-over-year sales since mid-2007. It's unusual to see food rank so low; however, automobiles and electronics certainly count as discretionary purchases and if the economy is under pressure we would expect to see some weakness in electronics and in auto sales; that appears to be the case in France.

    Other categories show sales rankings that range from firm-to-strong. Strong sales emerged in footwear, a small-ticket item, where an 84.2 percentile standing derives from a year-over-year growth rate of 7.2%. Household appliances, a heftier household expenditure, show a 5.1% increase in sales volumes for an 81.8 percentile standing, also a strong result. Furniture sales, where the growth rate is a milder 1.3%, still scores a 71.3 percentile standing for this period. Textile sales are up by 1.5% year-on-year, which scores an above-median 67-percentile standing. For all industrial goods, a 0.5% increase in spending marks a 56.5 percentile standing overall, a small gain above its historic median rate.

  • German industrial output advanced in November but is currently riding a string of 18 straight months of year-over-year declines for output excluding construction (the headline series).

    The increase in monthly output marks ‘one in a row,’ two increases in the last four months, and three increases in the last six months. There have been six month-to-month increases in the last 12 months. Still, the year-on-year change is -2.8%, an improvement from drops of five-percent or so in September and October but August of 2024 showed a year-on-year drop of only 2.7%; yet, that was not a signal of coming improvement.

    Apart from output itself, order momentum is not improving. Real manufacturing orders fell by 5.4% in November after falling by 1.5% in October, but that series has risen a strong 7.2% month-to-month in September. Real orders show a progression toward less decline over three months, six months, and 12 months. Still, the quarter-to-date annualized change in real orders is falling at a 7.1% annual rate.

    On balance, it is hard to say that there is any light at the end of the tunnel for German output and its prospects based on IP trends or on real-order trends.

    Sales trends are not much better although real sales rose by 1.4% in November; the decline over three months, six months and 12 months and have ‘generally’ been weakening.

    Surveys show weakened trends from 12-months to 3-months.

    In addition, the queue standings of all the IP categories, orders, real sales and the relevant German surveys have low standings- in all cases below 50%- putting all of them below their historic medians. The surveys are especially weak with standings below the 15th percentile in all cases. Among manufacturing output, real orders, and real sales the strongest standing is orders with a percentile of 33%. For the IP headline series itself, the standing is at its 18.4 percentile; consumer goods is strongest at a standing of 31.2%, with capital goods at 22% and intermediate goods at 17.4%. The readings for manufacturing in Germany are weak no matter how you view them.

    The table also surveys early IP data for Portugal and Norway. These queue standings apply to year-on-year growth rates, and both are above the German standing of 18.4%, with Portugal at 39% and Norway at a 52.7 percentile standing above its historic median.

    The far-right column also assesses the current IP level relative to where it stood on January 2020. The IP headline index is 12 IP index points lower. Construction is 13 index points lower; manufacturing as a total is 10.8 points lower, similar to the drops for real manufacturing orders and for real manufacturing sales. The surveys are on very different scales. The ZEW current index is 81.9 points lower, with the IFO manufacturing index lower by 8.8 points. Despite the difference in the construction of these indexes, these drops both have percentile standings in the 4% to 5% range. Skipping down the table, we quickly see Portugal has fallen by 9.9 IP points compared to its January 2020 level, while Norway has risen by 1.1 point and has an above-median standing, as a result.

    These data are disappointing. Quite apart from the near-term momentum – which is weak- the big picture is severely impacted. And it is not getting better despite a small increase in the November output.

  • The EU Commission index for the EMU area fell in December after remaining steady in November and declining in October. November had seen increases in EMU Commission country-level sentiment readings in all but 15 of the 18 early reporters. However, now, in December, the EU country level readings are falling in 13 of 18 early reporters, including in three of the four largest EMU economies.

    In December, sector readings show that EMU-wide the industrial readings fell sharply, consumer confidence backtracked as retailing and construction were at unchanged readings month-to-month. Strengthening month-to-month was only the service sector reading.

    In terms of standings, the overall EMU standing is at the 24.7 percentile, right at the border of the lower quartile. The industrial sector has a bottom 12.8 percentile standing, with consumer confidence at its 25.4 percentile standing. Services, despite the sector’s rise this month, has only a 35.9 percentile standing. However, retail and construction have standings that are above their respective medians at a 69.4 percentile in retailing and a 72.3 percentile for construction.

    Despite bottom quartile consumer confidence standing, retailing has a 69.4 percentile standing. This seems unusual for retailing to hold up so well despite such weak overall sentiment and such weakness in consumer confidence.

    Country readings show only five are above their historic medians. Only the small EMU nations Cyprus and Lithuania have sentiment standings above their 70th percentile. In contrast, nine countries have percentile standing below their 30th percentiles – including the EMU overall metric.

  • EMU inflation rose by 0.2% in December after gaining 0.1% in November and rising by 0.3% in October. The headline rate is up for three months in a row. The year-on-year pace is 1.7% in September, rises to 2.0% in October, to 2.3% in November, and then to 2.5% in December. These are small changes to be sure, but it is a clear adverse trend.

    EMU-wide core inflation fell from 3.3% year-over-year in February 2024 to 2.9% in March 2024. For March onward, the core rate has fluctuated between 2.8% and 3.0% - nine months running with the December core reading as yet unavailable.

    While headline inflation appears to be toeing the line on inflation, the core is stuck nearly a percentage point higher. But growth in the EMU area is weak and the ECB has been cutting rates largely without opposition in this environment.

    The trends are more convoluted. In the table, the country level data among large EMU members shows headline HICP rates are accelerating over three months compared to six months. In Germany, inflation accelerates over six months compared to 12 months and over three months compared to six months. Only Italy shows headline inflation lower over three months than it is over six months and in the case of Italy inflation is falling at a 1.6% annual rate.

    Core inflation or ex-energy measure are in the table for Germany, Italy, and Spain. Italy and Spain show core inflation decelerated to a sub 2% pace over three months. But in Germany, ex-energy inflation is stubborn at 3.1%, the same as its six-month pace.

  • The S&P composite PMI tracks economic performance across manufacturing and services sectors for a group of 25 countries; it shows mixed performance in December with conditions slightly slowing for just over half of the reporters. However, among the larger economies, conditions are largely improving with the United States improving and with the European Monetary Union improving in December, including the large individual members of the union: Germany, France, Italy, and Spain. Japan also improves month-to-month in December although among large economies the U.K. economy worsens and worsens for the third month in a row. Condions in China also deteriorate.

    The U.S. shows composite conditions improving over 12 months, six months, and three months based on averages, as does Ireland, and Sweden, and Hong Kong. Worsening consistently from 12-months to six-months to three-months is only India. In the case of India, this is a slowing from extremely high readings as the percentile standing for India's composite in December is in its 71.9 percentile tying it for the fourth highest percentile ranking in this sample of countries over the last five years.

    While there was still a great deal of slowing, there wasn't that much contraction going on in this group of countries. Only 6 composite readings are below 50, indicating contractions in December compared to seven in November and October. Over three months averages show only 7 contracting; over six months, eight are contracting; and over 12 months six are contracting. In terms of percentile standings, however, 15 of the 25 reporters in the table show relative standings below their medians over the last five years so relative weakness is the rule although contraction is not.

    The unweighted average for the sample is for a composite PMI reading of 51.8 which shows a bare-bones expansion. The unweighted U.S., U.K., and European Monetary Union average is at 51.8, the G-7 weighted average is at 52.8, while the G-6 average, that excludes the U.S., is at 48.9. The G-7 weighted average has a 52.6 percentile standing over the last five years while the G-6 GDP-weighted average has only a 29.8 percentile outstanding emphasizing the strength that the U.S. economy imparts to any measure of the performance of the most advanced economies.

    Ranked over the last five years, only 10 economies have standings above their medians for this period. The median for the whole sampler is at a 43.9 percentile standing; the average is at a 48.6 percentile standing- there's currently still a great deal of weakness among these countries. The weakest standing in the sample is for France at a 21.1 percentile standing with Singapore's 24.6 percentile standing running a close second, the U.K. ranks third worst at 26.3 percentile, and Ghana's 28.1 percentile standing is in 4th place.

    There's little evidence of trend as the chart above shows. The G-7 reading over 12 months, six months, and three months is locked in a narrow range between 52.2 and 52.6; the G-6 range is lower but also narrow between 49.0 and 49.9. The overall average fluctuates between 51.8 for three months and 52.0 over 12 months. For the most part, we're getting readings that are in the growth category but simply not very impressive and readings that are quite low by the standards set over the last five years which was by itself or relatively listless.

  • The readings improve a bit in December, moving the median to 49.7 from a 3-month average of 49.3. The average of manufacturing among reporting Asian contributors have moved up above 50. The BRIC average remains above 50 but has slipped a bit lower on the month.

    However, overall, the percentage of reporters that improved month-to-month is only 27.8%. Two thirds improve over three months compared to six-months based on comparing the averages; 22% improve over six months compared to 12-month averages. And two-thirds improved over 12 months compared the 12-month average from one year-ago. This is not a strong record of improving trends based on breadth.

    The changes in the medians calculated over 12 months, 6 months and 3 months show that the median readings have been steadily eroding.

    The queue standing places an ordinal ranking on each contributor over data since January 2020. Among the 18 reporters in the table, only five have queue standings above their 50% level (above their respective medians calculated over this period). Four of the countries have standings in the 50-60 percentile range with the highest rankings at a 63.3 percentile standing (Taiwan). China, India, Mexico, and Canada (all either BRIC or U.S. MCA members) are the remaining countries with standings above their historic medians.

    Eight reporters in the table have PMI values in December that are above the values they posted in January 2020. The strongest reading is reported by Russia, at a gain of 2.9 points (really?) with the weakest, a drop of 9.1 points in France. The U.S., the U.K., Germany, and the euro area all have drops over this period of 2.5 points or more. The most developed countries seem to be having the hardest time during this episode.

    PMI standings log a median at 38.3% for reporting countries over the last five years of data. The High-Low percentages find that Mexico, China, and India have standings in the upper 20 percentile of that range (as opposed to their queue percentile) of data. Only the most developed countries and the euro area, Germany, France, the U.S., the U.K., and Brazil have percentile standings below their high-low midpoints (below the 50 mark).

    While the U.S. economy is showing signs of ongoing and even improving growth, the rest of the world is not. Even in the U.S., manufacturing is the laggard sector. The graph shows that since early-2023 there has been little improvement.

  • Italian consumer confidence edged lower in December as business confidence in manufacturing notch lower as well. Consumer confidence has slipped for three months in a row. But still has a 67-percentile standing on data back to 1997.

    The last 12 Months Consumers rate the overall situation over the last 12-months as slightly weaker, falling on balance over three-months and with a 61.2 percentile standing.

    Looking ahead- Over the next 12-months- the overall situation has slipped for three months in a row and is net lower over 12-months as well. The expected overall situation has strengthened but lies only in its 23rd percentile, which is quite weak. Expected unemployment conditions are slightly weaker in December and lower on balance over 3-months and 12-months with a 69.3 percentile standing. Household budgets weakened in December but have strengthened on balance over 3-months and 12-months. The standing for the response is in this 77the percentile robust in the face of deteriorating unemployment prospects.

    The household situation for the last 12-months improved in December and had improved over the past 3- and 12-months. With a 68-percentile standing. But, looking ahead over the next 12-months, conditions are slightly weaker in November and December than in October and slightly lower on balance over 12-months. The standing on this metric is in its 13th percentile. As firmly as conditions were viewed for households over the last 12-months there is just as much concern about the future spinning that forward.

    The prospect for making major purchases is unchanged month-to-month but weaker on balance over 3-months with a midrange standing in December just above its historic median at its 52.5 percentile.

    Italy has had stronger ranking confidence reading than many other EMU members, by may not be losing its advantage as its forward-looking metrics are losing purchase.

  • Industry climate improves slightly in December while for services the climate situation eroded. But both of the series are in a significant long term down trend from 2021 onward. Between Covid and the Russian invasion of Ukraine, the French economy has been under unrelenting pressure that recently appears to have taken on an even weaker dimension.

    Manufacturing Production expectations weakened further in December from November after production expectations weakened in November as well. However, orders and demand show that overall order and foreign orders improved in December compared to November. The price outlook weakened for firms assessing their own pricing prospects but accelerated in evaluating the overall prospects for prices in manufacturing.

    In terms of rankings… the rankings on all these categories are substantially below 50, a ranking that marks the historic median for each series. The only exceptions to this are two: foreign orders & demand that have a 68-percentile standing and inventories with a 78-percentile standing. Manufacturing in France is weak and while the industry climate reading moved up in December most components assessing the sector weakened in December.

  • United Kingdom
    | Dec 18 2024

    UK Industry Sees a Bleak Future

    UK industry turns a corner for the worse… The report on the United Kingdom industrial sector survey in December from the CBI is a crushing blow to anyone looking for recovery to take hold in the United Kingdom led by the industrial sector. The report shows significant, substantial, and even enormous deterioration in December in metrics involving total orders export orders and expected volume over the next three months. There is no silver lining here and, in fact, to make matters worse in the face of all of this weakness and expected weakness… average prices expected over the next three months move up sharply in December compared to what had been expected in November.

    Total orders declined to reach a reading of -40 in December from -19 in November. Export orders in December slipped to -37 after logging -27 in November. The only thing close to a silver lining here is that the stocks of finished goods have a reading of 20 slightly lower than 21 in November indicating that inventories are not piling up at the moment and adding to and more horrific inventory cycle. Nonetheless diffusion readings on stocks of ‘20’ and ‘21’ are quite high.

    Looking ahead In the looking ahead category, we have output volume for the next three-months fall to a reading of minus 31 from plus 9 in November. This is a really sharp slowdown that leaves the output volume series in the 2.3 percentile of its queue of data back to 1992, an extremely low reading. Average prices for the next three-months at the same time take on a diffusion value of 23, up from 11 in November after having got to zero in October. The reading of plus 23 in December has an 87-percentile standing, an extremely high level indicating that not only is growth in trouble but that inflation, or at least expected inflation, is back.

    A drop in expected output of historic proportions The drop in expected output three-months ahead is a 40-point shift month-to-month (to -31 from +9) on data back to 1990. This is the second worst shift in the monthly reading in this survey, surpassed only during Covid in April of 2020. That is especially shocking since, at that time, there was a specific event to account for the shock-shift in expectations, unlike now. Now, the UK faces a period of domestic political stability, a world with global political shifts in progress in other countries – a changing of the geopolitical guard - and economic struggling as well as ongoing war in Ukraine and a worsening of instability in the Middle East. But this CPI reading is a horrific decline to impact one month’s reading. Meanwhile, most of those background events are not new and have been in progress. It appears that some watershed has been passed that businesses can no longer ignore.

    Dilemma at the BOE Of course, the Bank of England has flipped the switch and has been cutting interest rates. And at its last meeting while it cut rates there was an accompanying message that it might be a while before the bank cut rates again. And now the bank is being put in a real dilemma because the state of the economy seems to call for rate reductions while the inflation background seems to call for rate increases. Welcome to the wild whacky world of central banking!

    Weakness across the board The percentile standings of the various categories show total orders at a 6.5-percentile standing, extremely weak with export orders at a 14-percentile standing, stocks -while not changing much month-to-month - have an 89.6-percentile standing. As noted, the output volume for the next three-months has a 2.3-percentile standing with prices expected over the next three months at an 87-percentile standing. There's nothing here that's good news and nothing that is going to make policy making in the United Kingdom any easier. It's certainly going to make life for the new government much more difficult and policy at the Bank of England much more contentious. It's definitely not a good way to end the old year and to usher in a new one but reality is what it is and in the United Kingdom the reality has just turned quite sour.

  • The Zew reading from the survey of financial experts in Germany produces a view of a weaker economic situation in the Euro-Area and in Germany but with some improvement in the United States. The degree of improvement is small for the US and the deterioration is small for Germany. The index ranking falls to -93.1 from -91.4 for Germany, however, for the Euro-Area the setback is considerably larger to a reading of -55.0 from a reading of -43.8 in November. As a result of these shifts on the month, the queue percentile standing for the Euro-Area has slipped to 27.9%, Germany remains extremely weak at a 2.7 percentile reading, while the US reading stands much stronger, at 48.2% just below its historic median which occurs at a ranking of 50%.

    Expectation assessments for Germany and the US show opposite movements with Germany moving up to 15.7 from 7.4 in November while the US slips back to 8.9 in December from 13.3 in November. The expectations readings are not as depressed on a ranking basis as the current statistics are, with Germany moving up to a 44.4-percentile standing and the US slipping back to a 58.1-percentile standing. The US ranking is still above its historic median reading. Improvement for Germany brings the December reading up close to its six-month average and above its three-month average.

    Inflation expectations continue to fall in the Euro-Area and in Germany. In the Euro-Area the fall is relatively sharp to a reading of -23.9 from -13.4 in November; for Germany it's a fall to -25.7 in December from -14.7 in November. The US sees an increase in inflation expectation to plus 12.6 in December from plus 2.7 in November, giving it two straight months of net positive readings on inflation expectations. The queue standings for the period put Euro-Area expectations at a 19-percentile standing, with Germany close by at an 18.1 percentile standing, compared to the US at a 29.6 percentile standing. All of these are below their historic medians, but the US clearly is showing more of a tendency toward inflation in the view of the Zew financial experts.

    Short term interest rate expectations have weakened in the Euro-Area as they have moved up in the United States, which is what you would expect with the shifts in inflation expectations that have been recorded by the Zew experts. The Euro-Area has a ranking of current short term rate expectations at 1.1%, an extremely low ranking, while in the US has short term rate expectations only at 6%, still extremely low.

    Long term rate expectations for Germany have strengthened to a diffusion reading of -3.2 from a reading of -13.3 and for the US they've strengthened more sharply moving into positive territory at +11.4 up from -0.6 in November. The long-term rate expectations for Germany have a 10.7-percentile standing, while for the US the standing is approximately double at 20.5-percentile. Both of these, of course, are still quite low and well below their historic medians that would occur at a ranking of 50%.

    Stock market expectations produce positive diffusion readings across the board but a weakening ranking for the Euro-Area, for Germany, and for the US. While the US has the strongest net diffusion reading and the strongest ranking, it also has the largest step back from November to December as US stock market expectations fall to 31.9 from 53.5. In the case of Germany, they fall to 13.3 from 17.8; for the Euro-Area stock market expectations dropped to 16.5 from 21.9. The Euro-Area ranks at 10.9 percentile, with Germany at the 8.2-percentile level, they compare badly to the US at a ranking of 56.4 percentile, above its historic median.

    The Euro-Area reading is continuing to be quite weak, while U.S. data have been stronger, and we see this reflected in exchange rate movements with the dollar firming. However, economies don't simply move in a linear fashion and while US retail sales recorded on Tuesday, we're quite a bit stronger than expected US industrial production for November unexpectedly stepped back, keeping the US manufacturing sector on the same week footing that we continue to see reported globally. That weakness was well demonstrated in the S&P manufacturing PMIs as reported yesterday. The global economy continues to struggle and to be supported by its services sector.