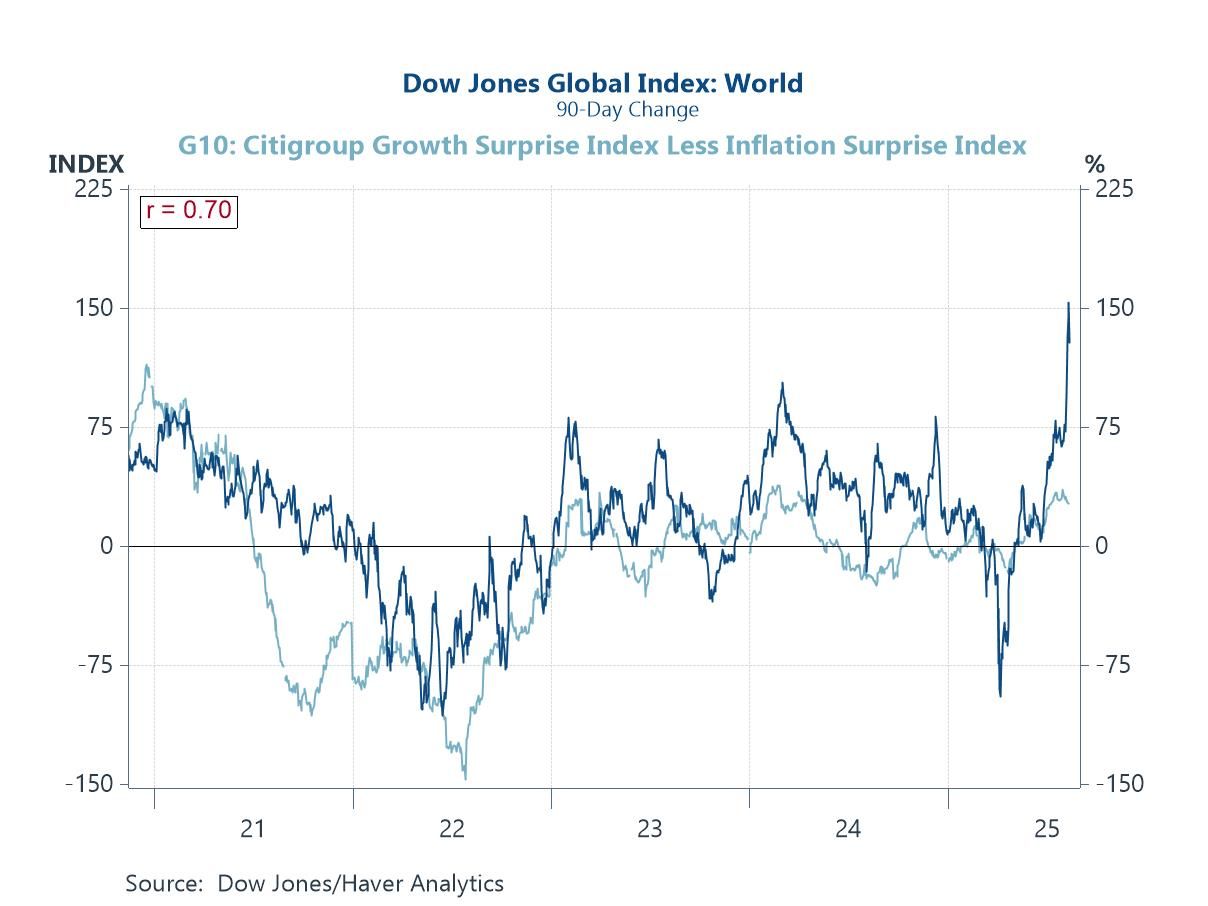
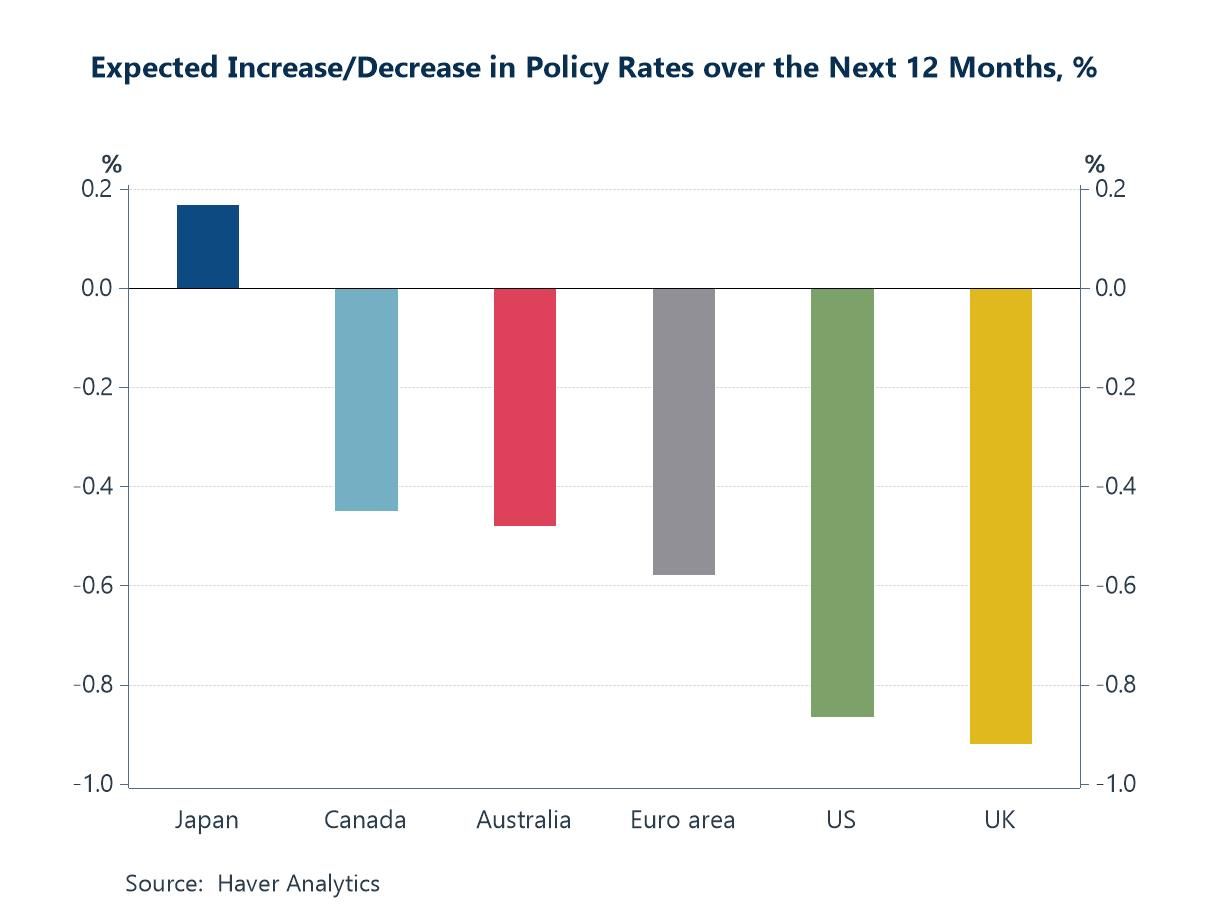
Global financial markets head into late summer buoyed by resilient risk appetite, underpinned by hopes that AI will boost productivity and growth alongside expectations for further central bank policy easing (chart 1). Yet this optimism has not been fully mirrored in the macro outlook: US non-residential investment forecasts for 2026 have been marked down in recent months, and global growth projections — particularly for US-exposed economies — have also softened, arguably reflecting tariff-related uncertainty (charts 2 and 3). This week’s data have nevertheless been friendly for the idea that further policy easing will be enacted in the months ahead. In the US, a benign July inflation report has, for example, bolstered expectations of a September Fed rate cut (chart 4). And in the UK, weaker labour market data have raised hopes of further BoE easing despite the hawkish tone that accompanied last week’s rate cut (chart 5). Meanwhile, falling global energy prices are also providing an important counterweight to the inflationary risks posed by US tariff measures, a balance that could be central in shaping the path of interest rates into year-end (chart 6).
Introducing
Andrew Cates
in:Our Authors
Andy Cates joined Haver Analytics as a Senior Economist in 2020. Andy has more than 25 years of experience forecasting the global economic outlook and in assessing the implications for policy settings and financial markets. He has held various senior positions in London in a number of Investment Banks including as Head of Developed Markets Economics at Nomura and as Chief Eurozone Economist at RBS. These followed a spell of 21 years as Senior International Economist at UBS, 5 of which were spent in Singapore. Prior to his time in financial services Andy was a UK economist at HM Treasury in London holding positions in the domestic forecasting and macroeconomic modelling units. He has a BA in Economics from the University of York and an MSc in Economics and Econometrics from the University of Southampton.

Publications by Andrew Cates
 Global| Aug 07 2025
Charts of the Week: Downside Risks
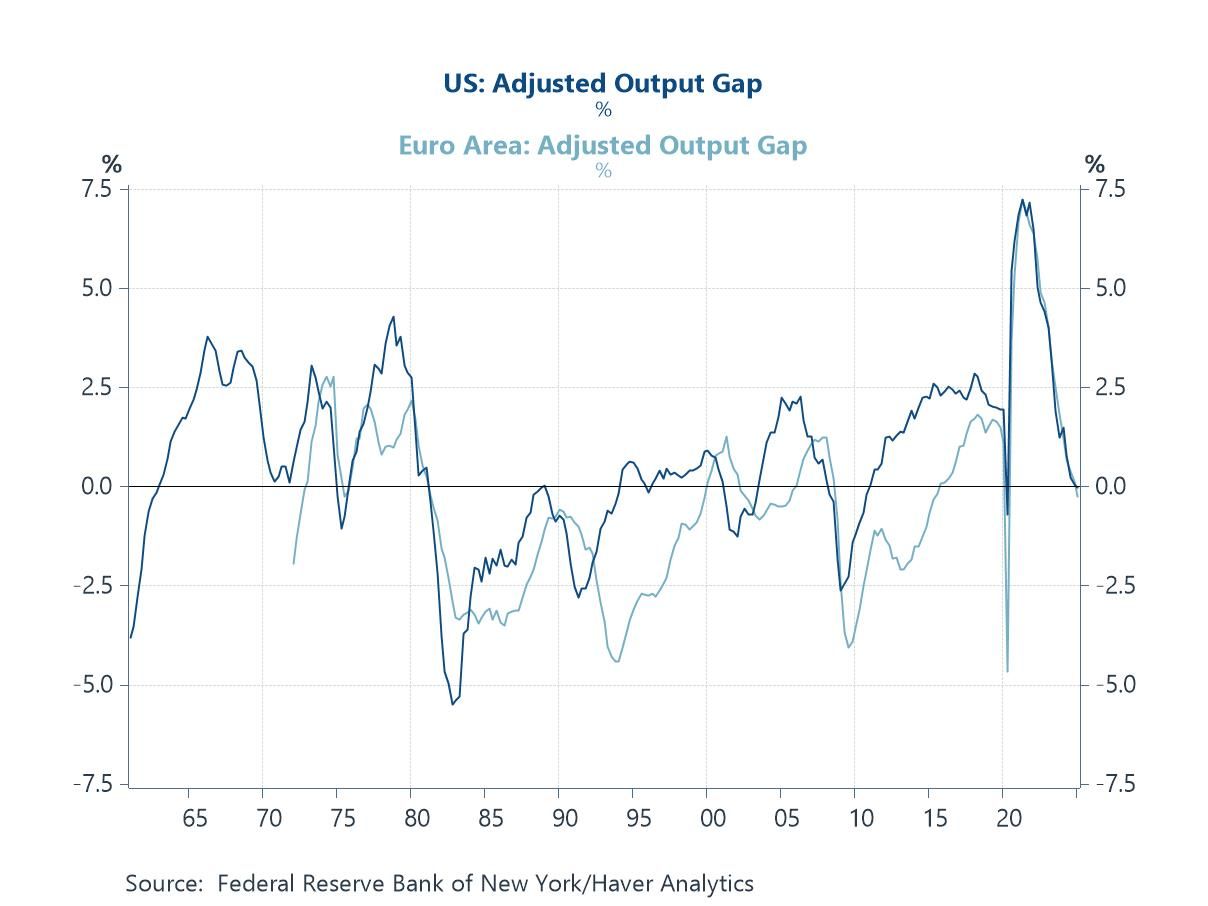
Last week’s weaker-than-expected US labour market report—marked by sluggish payroll growth, rising unemployment, and downward revisions to prior months—sparked a notable shift in financial markets. Bond yields fell sharply as investors repriced the outlook for Fed easing, with rate cut expectations brought forward. This recalibration arguably reflects growing awareness of mounting downside risks across the US and broader global economy. Several indicators reinforce this view. Output gaps in many major economies are narrowing or turning negative, signalling that demand is falling short of potential (chart 1). The US housing market looks fragile, amidst weak builder sentiment and falling prices (chart 2). US bank lending standards are still restrictive, with implications for credit availability, household and business investment, and overall economic momentum (chart 3). Some (though not all) global sentiment surveys have softened, and positive growth surprises are now fading. Meanwhile, and despite earlier fears, US tariffs have not triggered renewed supply chain stress or inflationary pressures (chart 5). Add to that the ongoing deflation in China’s producer prices, and the macro narrative could be tilting more decisively toward slower growth and diminishing inflation risks—leaving policymakers with more space to continue easing monetary policy (chart 6).
by:Andrew Cates
|in:Economy in Brief
 Global| Jul 31 2025
Charts of the Week: Markets Rally, Risks Linger
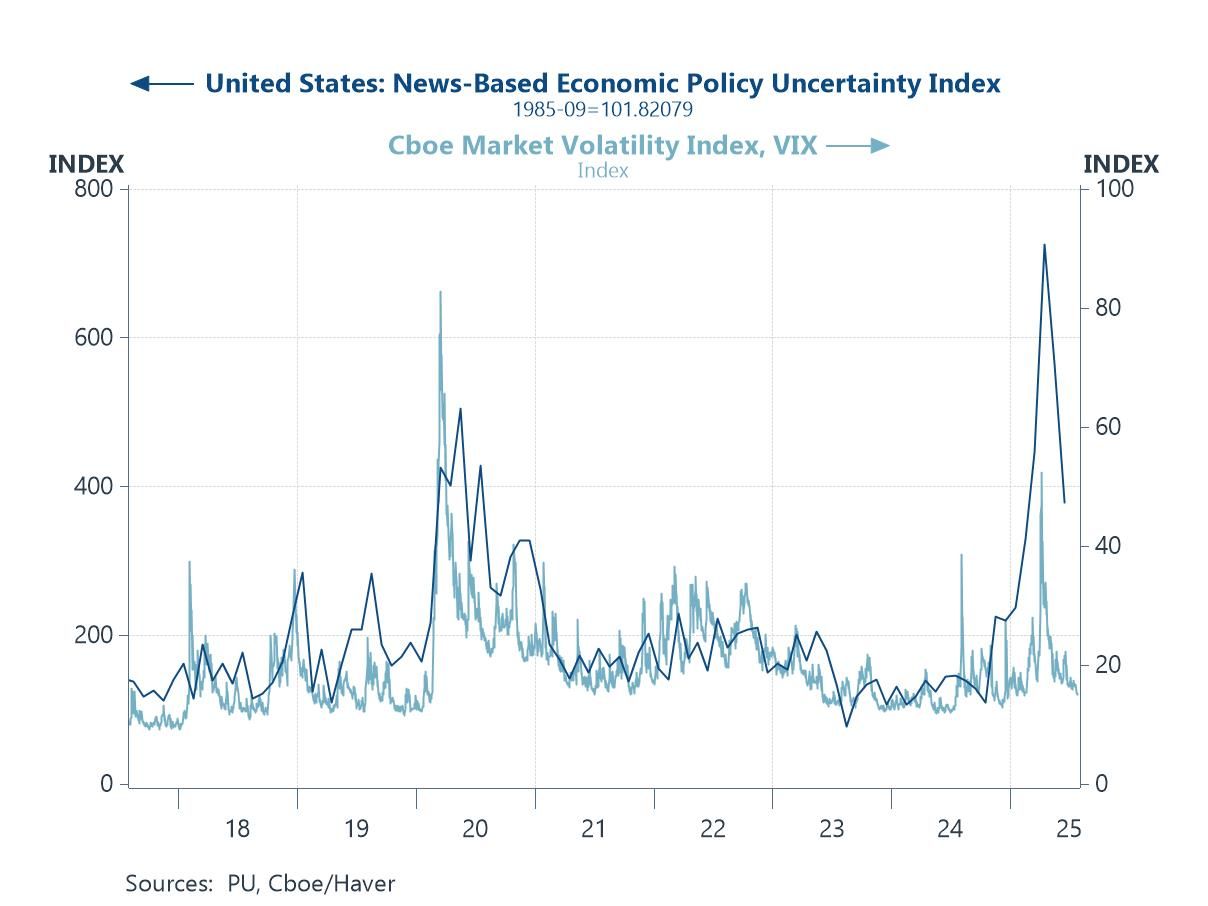
Financial markets have performed well in recent weeks, lifted by stronger data, moderating inflation, and renewed soft landing hopes. Equities have pushed higher, volatility has eased, and credit markets have firmed. While economic policy uncertainty remains elevated, it is showing signs of normalising alongside greater clarity on US trade policy (chart 1). The US dollar, however, remains under pressure amid concerns about Fed independence and broader policy credibility (chart 2). The Fed’s decision on July 30th to leave policy on hold, despite two dissenting votes in favour of a cut, arguably did little to ease those concerns. Recent US trade agreements—particularly with Japan and Europe—have boosted sentiment, though questions linger over implementation. In Japan, trade policy uncertainty has surged amid vague deal terms, even as exports to the US have weakened (chart 3). In the euro area, M3 growth slowed in June as private credit softened, casting doubt on the durability of recent upside surprises (chart 4). UK retail data signal a sharp drop in consumer activity, consistent with past recessions (chart 5), and the change in US house prices has turned negative on a three-month basis—often a warning sign of broader economic weakness (chart 6). Overall, while market sentiment has improved, risks tied to credit, demand, and housing persist.
by:Andrew Cates
|in:Economy in Brief
 Global| Jul 08 2025
Charts of the Week: Summer Resilience
There will be no Charts of the Week publication for the next couple of weeks. The next edition will be released on Thursday, July 30th.
Recent buoyancy in global equity markets reflects a welcome mix of encouraging signals: growth is holding up better than many feared, inflation surprises have turned more benign, and most major central banks are poised to continue lowering interest rates in the period immediately ahead (charts 1, 2 and 3). There are, however, pockets of strain beneath the surface. Trade growth in Asia has slowed, most visibly in exports to the US, as tariffs and lingering tensions weigh on key sectors (chart 4). At the same time, China’s rising capital outflows point to firms and investors hedging their bets by shifting more assets abroad (chart 5). These undercurrents hint at an uneven global picture where trade frictions and capital shifts could test the durability of the recent calm. On a more positive note, the strong, steady climb in renewable energy production is a bright spot, underscoring the scale of investment pouring into the clean energy transition—even as real energy costs remain firm (chart 6). Altogether, while the broader backdrop remains supportive, new trade barriers, shifting capital flows, and the hidden costs of the green transition are watchpoints that could unsettle markets if growth momentum stalls or policy missteps occur.
by:Andrew Cates
|in:Economy in Brief
 Global| Jul 02 2025
Charts of the Week: Headwinds and Heatwaves
Financial markets have remained generally buoyant in recent days, with global equity indices advancing on the back of relatively upbeat global growth data, benign European inflation readings and the prospect of further policy easing from major central banks. At the same time, the US dollar has continued to weaken, reflecting a run of disappointing US economic data and rising investor concerns about the fiscal outlook, even as European growth surprises have turned more positive. This divergence, combined with the prospect of lower US policy rates relative to some (though not all) peers, has added to the dollar’s drift lower (charts 1 and 2). Supply chain strains—highlighted by elevated vessel queues at US West Coast ports—also feed into the narrative that US tariff measures may be contributing to sticky input costs and stagflation risks (charts 3 and 4). Meanwhile, record temperatures in parts of Europe this week have reinforced the climate challenge facing policymakers, with the final two charts illustrating how rising global temperatures and heat stress could increasingly weigh on productivity and growth potential if left unchecked. With trading volumes light ahead of the July 4th holiday and markets awaiting tomorrow’s US non-farm payrolls report, the interplay between softer US data, resilient equities, a weaker dollar, and climate-related risks remains firmly in focus.
by:Andrew Cates
|in:Economy in Brief
 Global| Jun 26 2025
Charts of the Week: Calmer on the Surface, Cracks Beneath
Financial markets have been on a geopolitical rollercoaster in recent days. The Iran–Israel flare-up briefly sent oil prices surging and risk assets tumbling, but tensions have since eased and market conditions have stabilised. That calm has refocused attention on underlying fundamentals—and the signals are mixed. Business surveys and Asian trade data (charts 1 and 2) suggest global growth momentum has held up well, despite the recent US tariff shock. But consumers are painting a more cautious picture: confidence remains subdued across the US, UK, and Eurozone, pointing to a more fragile backdrop (chart 3). In the US, signs of softer growth and inflation have caught the Fed’s eye, with several officials adopting a more dovish tone in recent days (chart 4). Yet structural risks continue to loom large. The sustained strength in gold and bitcoin reflects ongoing unease over inflation, financial stability, and broader geopolitical risk (chart 5). And the energy transition remains a critical faultline. Fossil fuels still dominate electricity generation, and while renewables are growing, they are arguably not scaling fast enough to meet rising demand or climate goals (chart 6). In short, climate risk and geopolitical instability continue to cast a long shadow over the outlook—well beyond the reach of monetary policy.
by:Andrew Cates
|in:Economy in Brief
- Global| Jun 26 2025
When Growth Eats Its Foundation
In recent months, I’ve been exploring how deep structural constraints—on labour, capital, and above all, energy—are reshaping the world economy. What’s become increasingly clear is that we’re moving away from the familiar rhythm of demand-led recoveries and into something more constrained, more structural. Growth isn’t just slow—it’s bumping up against hard supply-side ceilings. Some of those were pandemic-induced. Others were physical. Many, increasingly, are ecological.
Arguably at the heart of that shift is energy. Not as an afterthought or cost input, but as a binding constraint. As I’ve written before, energy isn’t just another factor of production. It’s the factor that makes all other inputs productive. Without energy, capital is idle, and labour is inert. But to understand the full extent of this transformation—and where it’s leading—we need to look beyond energy itself, to the natural systems that support it.
by:Andrew Cates
|in:Viewpoints
 Global| Jun 18 2025
Charts of the Week: Conflict, Energy and Constraints
Financial markets have been jolted over the past week by a sharp escalation in geopolitical risk. The sudden intensification of hostilities between Israel and Iran—marked by missile strikes and retaliatory air operations—has reignited fears of a broader regional conflict with global consequences. This flare-up has driven a visible spike in geopolitical risk indicators (Chart 1), unsettling investor sentiment at a moment when markets were still digesting the implications of US protectionist trade policies. As tensions mount, the economic shockwaves have been rippling outward: oil prices have rebounded sharply (Chart 2), global shipping costs have climbed sharply along key maritime routes (Chart 3), and capital markets are once again grappling with an unpredictable macro landscape. Iran’s strategic importance—both as a holder of nearly 10% of global oil reserves and as a key player in energy shipping lanes such as the Strait of Hormuz—underscores the vulnerability of global energy security (Chart 4). But the implications are not just immediate. Over the medium term, higher real energy prices have already been weighing on living standards and growth outcomes across many advanced economies (Chart 5), with the data pointing to a clear inverse relationship between real energy costs and gains in per capita GDP. Compounding this is the slow, structural erosion of natural capital—soils, forests, water systems—which continues to undermine long-run economic resilience and productive potential (Chart 6).
by:Andrew Cates
|in:Economy in Brief
 Global| Jun 12 2025
Charts of the Week: What’s Consensus?
Financial markets have experienced considerable gyrations in recent weeks, reflecting substantial shifts in investor expectations and heightened uncertainty, largely driven by ongoing US tariff policies. Over the past six months, consensus growth forecasts have seen notable downward revisions across most major economies, though these have been partially offset by modest upward revisions in the past month (chart 1). Concurrently, consensus inflation projections have diverged significantly, with upward pressures in the US contrasting with deflationary risks in China (chart 2). Compounding these US issues, renewed protectionism appears to be pressuring global supply chains again, potentially increasing inflation risks and sustaining elevated monetary policy uncertainty (charts 3 and 4). This week's particularly weak UK employment data highlight immediate domestic economic fragility, while longer-term economic stability remains challenged by persistently high real energy prices and complexities surrounding the energy transition (charts 5 and 6).
by:Andrew Cates
|in:Economy in Brief
 Global| Jun 05 2025
Charts of the Week: Fault Lines and Rate Cuts
Recent weeks have seen a complex recalibration in global financial markets, as investors weigh the implications of renewed US tariff actions against accumulating signs of economic softness and growing confidence in the prospect of central bank easing. As part of this recalibration, there has been heightened, if not uniformly sustained, concern about the safe-haven appeal of US assets, with long-dated Treasury yields rising at times on fiscal worries and the US dollar showing episodic vulnerability. Yet despite these concerns, consensus forecasts continue to anticipate meaningful policy rate cuts across most major economies (chart 1). Shorter-dated yields in bond markets have moved in sympathy, with 2-year Treasury yields, for example, have trending lower from mid-May, tracking a deterioration, albeit modest, in the US labour market (chart 2). Lower oil prices and a slew of negative inflation surprises have further softened inflation expectations (chart 3). In the euro area, wage growth and services inflation have also cooled, giving the ECB more latitude to reduce its policy rates again this week (chart 4). The growth backdrop, in the meantime, remains fragile, with global export demand and new manufacturing orders softening, and increasingly exposed to a drag from protectionist US trade policy (chart 5). Finally, China’s entrenched financial imbalances — persistent private sector surpluses, fiscal deficits, and external imbalances — remain a key source of domestic fragility and global distortion (chart 6).
by:Andrew Cates
|in:Economy in Brief
- Global| Jun 05 2025
Rebalancing Act: How Global Policy Shifts Are Rewriting the Rules of Capital and Trade
When the Balances Stop Balancing
In the global economy, nothing ever balances itself — it must be balanced. And the tool we use to understand that process is the financial balances identity:
(Private Sector Balance) + (Government Balance) + (Current Account Balance) = 0
This deceptively simple equation reminds us that the financial positions of households, businesses, governments, and the rest of the world are always interlinked — one sector’s deficit must be matched by a surplus elsewhere. But when policies distort trade and capital flows, they don’t eliminate this identity. They just shift the burden of adjustment — often suddenly and painfully — to another part of the system.
We’re now entering such a phase. As we explored in a previous piece (see the bond market and productivity), the global economy is confronting overlapping questions about how — and where — capital will be absorbed. That blog argued that it’s not simply a question of whether savings adjust (they must), but rather what mix of prices, policies, and expectations will force that adjustment — particularly as governments and firms simultaneously reach for the same pool of private capital to fund deficits and an AI-driven capex surge.
These concerns sit at the heart of what this next piece explores. Around the world, governments are pulling financial levers in conflicting directions. The United States is simultaneously contemplating financial transaction taxes, introducing punitive investment measures, and expanding fiscal deficits. Europe is loosening its purse strings in the name of strategic autonomy, while fast-tracking plans for a Savings and Investment Union that would re-anchor more capital within its borders. And China, still deeply mercantilist, is doubling down on export-led growth, capital controls, and state-directed investment — while keeping domestic consumption artificially suppressed.
Overlaying all this is a sharp resurgence in protectionist trade policy, with the United States now imposing tariffs across a wide swathe of imports. These frictions are not just policy noise — they are tearing at the global capital recycling mechanisms that once allowed persistent imbalances to be absorbed without systemic rupture.
As we wrote last time, markets may be pricing in an AI-led productivity renaissance — but if that narrative falters or is undercut by misaligned financial flows, the repricing could be swift and severe. And here’s the real concern: the fragile scaffolding that once allowed the world to function with these imbalances is now being dismantled — leaving a system where capital is needed in one place, unwanted in another, and increasingly blocked from flowing freely.
The United States Closes the Financial Tap
Suppose the US implements a tax on financial transactions or introduces new restrictions on foreign portfolio investment. This would mark a sharp reversal from decades of financial openness, fundamentally challenging the US model of attracting global capital to fund persistent fiscal and current account deficits.
Recent policy proposals, including those under the so-called "Big Beautiful Budget" clause and Section 899 of the Internal Revenue Code, point to a new willingness to weaponize financial channels. Section 899 allows for punitive taxation—so-called "revenge taxes"—on investors from countries deemed to have imposed discriminatory measures against the US. These steps create uncertainty for foreign capital and increase the risk premium on US assets.
If capital inflows shrink, the identity demands that either: • The current account deficit shrinks (via export gains or import compression), • The government deficit shrinks (unlikely given current policy), or • The private sector saves more than it invests.
This would strain the US economy. The dollar would likely weaken. Treasuries might lose some of their safe haven appeal, especially if yields rise to compensate for reduced foreign demand. Liquidity premia would widen. The US could no longer rely on the rest of the world to finance its deficits cheaply and reliably.
US Fiscal Expansion Without Financing
Now consider a parallel development: a renewed US fiscal expansion driven by tax cuts and defence spending. The federal deficit widens further. But with capital inflows potentially constrained, the private sector—households and corporations—must absorb the gap.
This creates a contradiction. Expansionary fiscal policy often tends to reduce household saving (more income, more consumption) and encourages firms to invest. But the financial balances identity demands the opposite: that the private sector save more to offset government dissaving and a flat or shrinking current account.
If private savings don’t rise, interest rates must. The result: pressure on equity and bond markets, and a risk that the US enters a cycle of high borrowing costs just as its productive potential hinges on long-term investment.
by:Andrew Cates
|in:Viewpoints
 Global| May 29 2025
Charts of the Week: The Yield Awakening
Financial markets have entered a more unsettled phase, with long-term yields, until very recently, rising notably across the US, Europe, and Japan. While inflation persistence and increased government borrowing have played a role, the moves also reflect broader concerns about global policy credibility and capital market dynamics. In the US, the unusual combination of higher yields and a weaker dollar points to growing risk premia linked to trade uncertainty and questions around institutional leadership (chart 1). At the same time, the withdrawal of central bank balance sheet support has continued to lift real yields across major economies (chart 2). Investors are also paying closer attention to savings and investment imbalances, where fewer surplus economies and persistent US deficits suggest a potentially tighter global savings environment (chart 3). Interestingly, the US stands out for a different reason: early signs of a productivity revival are emerging, possibly tied to AI investment and the broader digital infrastructure boom (chart 4). That contrasts with continued productivity stagnation in most other advanced economies (chart 5), where structural frictions and energy costs remain a drag. Indeed, the US may also be benefiting from a more fundamental edge—significantly cheaper electricity—giving it a further competitive advantage in this new capital- and data-intensive era (chart 6).
by:Andrew Cates
|in:Economy in Brief
- of22Go to 5 page