U.S. Personal Spending Picks Up & Income Growth Firms in September
by:Tom Moeller
|in:Economy in Brief
Summary
- Spending reflects strong service outlays.
- Income increases with stronger wage gains.
- Price inflation stays steady & strong.


Individuals remain inclined to spend, but price inflation continued to eat into the real value of both spending & income last month. The 0.6% increase (8.2% y/y) in personal consumption expenditures followed a like rise in August, revised from 0.4%. A 0.4% increase had been expected for September in the Action Economics Forecast Survey.
The nominal gain in spending was inflated by price inflation. The 0.3% rise (1.9% y/y) in real sending repeated the August rise. Real spending on durable goods edged 0.1% higher (7.9% y/y) last month as spending on motor vehicle & parts rose 0.9% (1.4% y/y) after improving 0.2% in August. Real spending of furniture & appliance held steady (-1.4% y/y) after falling 0.4%. Real spending on recreational goods & vehicles fell 0.2% (+5.8% y/y) after a 1.0% decline. Real spending on nondurable goods rose 0.6% (-2.0% y/y) after edging 0.1% higher in August as outlays on gasoline & other energy products surged 3.0% (-2.4% y/y) following a 2.4% August increase. Apparel spending jumped 1.3% (-0.2% y/y) following two months of firm increase as real outlays on "other" goods rose 0.4% (0.8% y/y). Food & beverage buying eased 0.3% (-5.6% y/y), falling in most months of this year. Spending on consumer services improved 0.3% (3.1% y/y) after rising 0.5% in August when adjusted for inflation. Real transportation services outlays improved 0.8% (3.9% y/y) after strengthening 2.0% but real housing & utilities expenditures rose only 0.1% (1.1% y/y) after holding steady in August. Real healthcare spending gained 0.3% in September (1.5% y/y), the same in the prior month. Recreation services buying improved 0.2% (5.7% y/y), half the August increase when adjusted for higher prices, but real expenditures at restaurants & hotels strengthened 0.6% (5.3% y/y) after a 0.9% August increase.
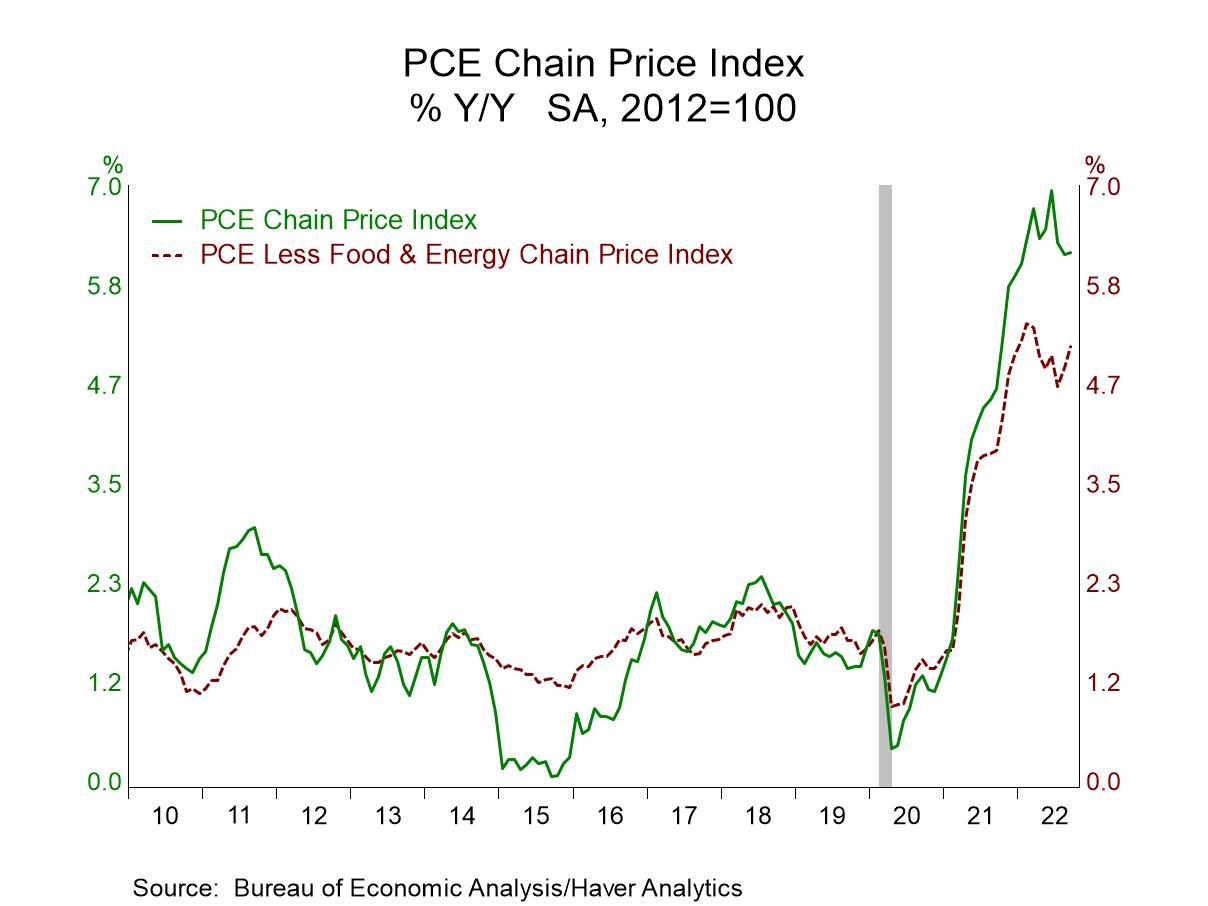
Inflation remined firm last month. The PCE chain price index rose 0.3%, the same as in August. The 6.2% y/y rise also was steady but remained below the June peak of 7.0%. It was nearly the highest rate of price inflation in over 40 years. A 0.5% m/m increase in the price index less food & energy also replicated the August gain. The 5.1% y/y gain was the biggest rise since the autumn of 1983. Food & beverage prices were up another 0.6% (11.9% y/y). Energy prices, in contrast, slid 2.4% (+20.3% y/y), the third straight monthly drop.
A second consecutive 0.6% rise (5.3% y/y) in the services price index powered the overall gain, driven by a 2.1% jump (16.4% y/y) in transportation prices. Housing & utilities costs rose 0.8% (8.0% y/y), following a 0.9% gain. Recreation services costs held steady (4.5% y/y) after falling 0.2%. The gain in the durable goods price index of 0.4% (5.7% y/y) came after a 0.5% August increase. Motor vehicles and parts (9.1% y/y) and home furnishings (8.6% y/y) each rose 0.1% in September. Recreational goods and "other" durable goods prices rose 0.5% (0.9% y/y) and 1.7% (2.9% y/y), respectively. Nondurables prices moved in the opposite direction, falling 0.4% (+9.5% y/y) as energy prices moved lower. The overall decline included a 0.5% drop (+5.7% y/y) in apparel prices which came after a 0.3% rise.
Personal income rose an expected 0.4% (5.2% y/y) during September, the same as in the prior two months. The gain reflected a 0.6% rise (8.2% y/y) in wages & salaries, mirroring continued employment growth. A 0.2% rise (4.7% y/y) in proprietors' income was accompanied by a second straight 0.2% gain (8.5% y/y) in rental income. Receipts on assets rose 0.4% (4.9% y/y) as interest income increased 0.6% (5.9% y/y) and dividend income improved 0.3% (3.8% y/y). Personal transfer receipts slipped 0.1% (-2.0% y/y). Disposable income rose 0.4% last month (3.2% y/y) after increasing 0.5% in August while real disposable earnings held steady (-2.9% y/y) following a 0.2% rise.
The personal saving rate fell to 3.1% in September, nearly equaling the lowest rate since April 2008. The level of personal savings fell 8.5% and was 59.3% lower y/y.
The personal income and consumption figures are available in Haver's USECON database with detail in the USNA database. The Action Economics forecasts are in AS1REPNA.


Tom Moeller
AuthorMore in Author Profile »Prior to joining Haver Analytics in 2000, Mr. Moeller worked as the Economist at Chancellor Capital Management from 1985 to 1999. There, he developed comprehensive economic forecasts and interpreted economic data for equity and fixed income portfolio managers. Also at Chancellor, Mr. Moeller worked as an equity analyst and was responsible for researching and rating companies in the economically sensitive automobile and housing industries for investment in Chancellor’s equity portfolio. Prior to joining Chancellor, Mr. Moeller was an Economist at Citibank from 1979 to 1984. He also analyzed pricing behavior in the metals industry for the Council on Wage and Price Stability in Washington, D.C. In 1999, Mr. Moeller received the award for most accurate forecast from the Forecasters' Club of New York. From 1990 to 1992 he was President of the New York Association for Business Economists. Mr. Moeller earned an M.B.A. in Finance from Fordham University, where he graduated in 1987. He holds a Bachelor of Arts in Economics from George Washington University.
More Economy in Brief


 Global