Despite Surging Food and Energy Prices, Households’ Relative “Discretionary” Spending Hit a High in April 2026
|in:Viewpoints
With food and energy prices surging in recent months, you might think that households would be cutting back on their real spending on “discretionary” goods and services, i.e., total goods and services excluding purchases of food, energy, clothing, housing and healthcare. After all, households would have to use more of their income to purchase higher-priced food and energy goods and services, leaving less income for the purchases of more discretionary goods and services. However, real discretionary (as I have defined it) household spending in April 2026 was 53.9% of total real spending, the highest percentage registered since the data started being reported, January 1959.
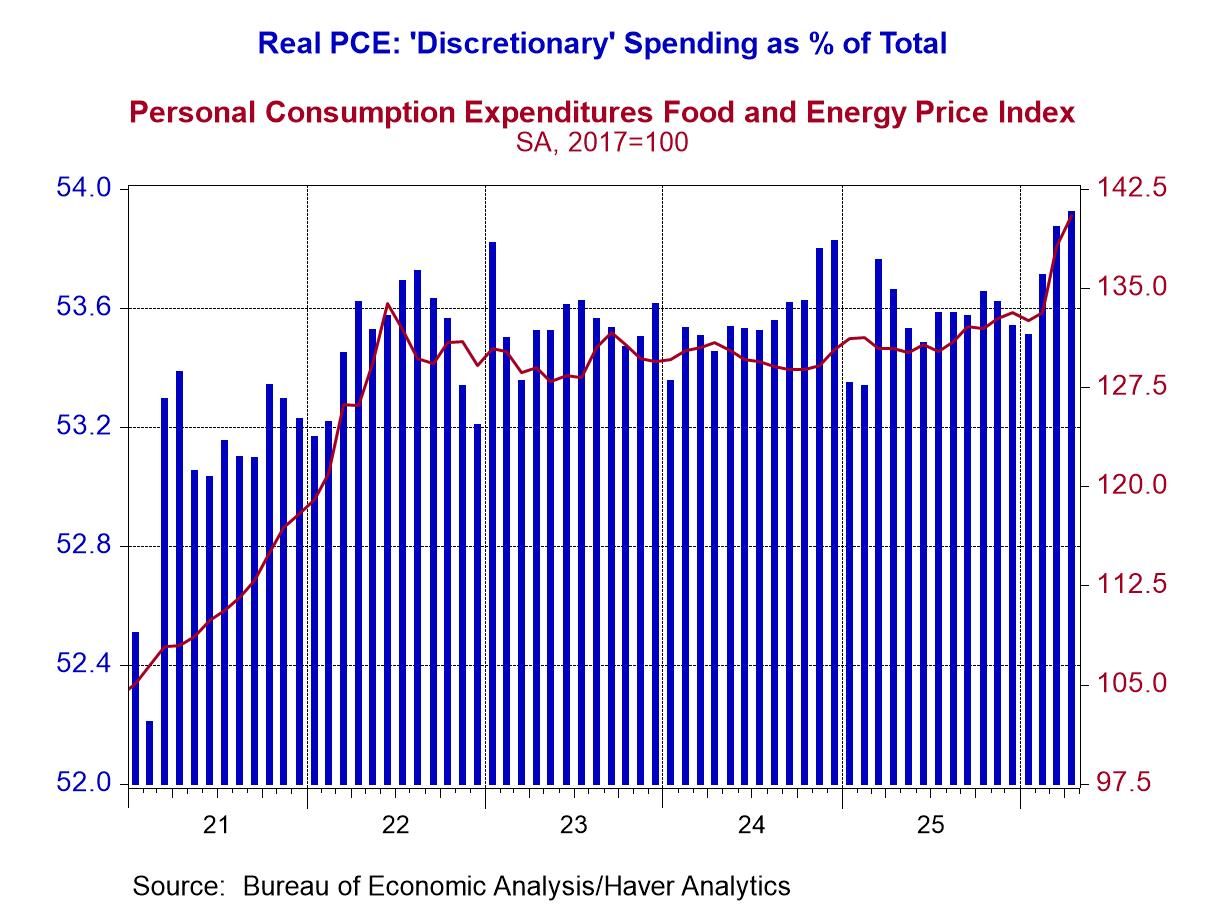
Plotted in Chart 1 are the monthly observations of discretionary real personal consumption expenditures as a percent of total expenditures (the blue bars) along with monthly observations of the personal consumption chain price index for food and energy goods and services (the red line). Notice that in the last three months starting in February 2026, the food-energy price index started rising, as did relative real consumer spending on discretionary goods and services. Similarly, back in 2022, food and energy prices were rising after Russia’s unprovoked invasion of Ukraine and relative real consumer discretionary spending also rose for several months. What might explain this counterintuitive phenomenon?
Chart 1
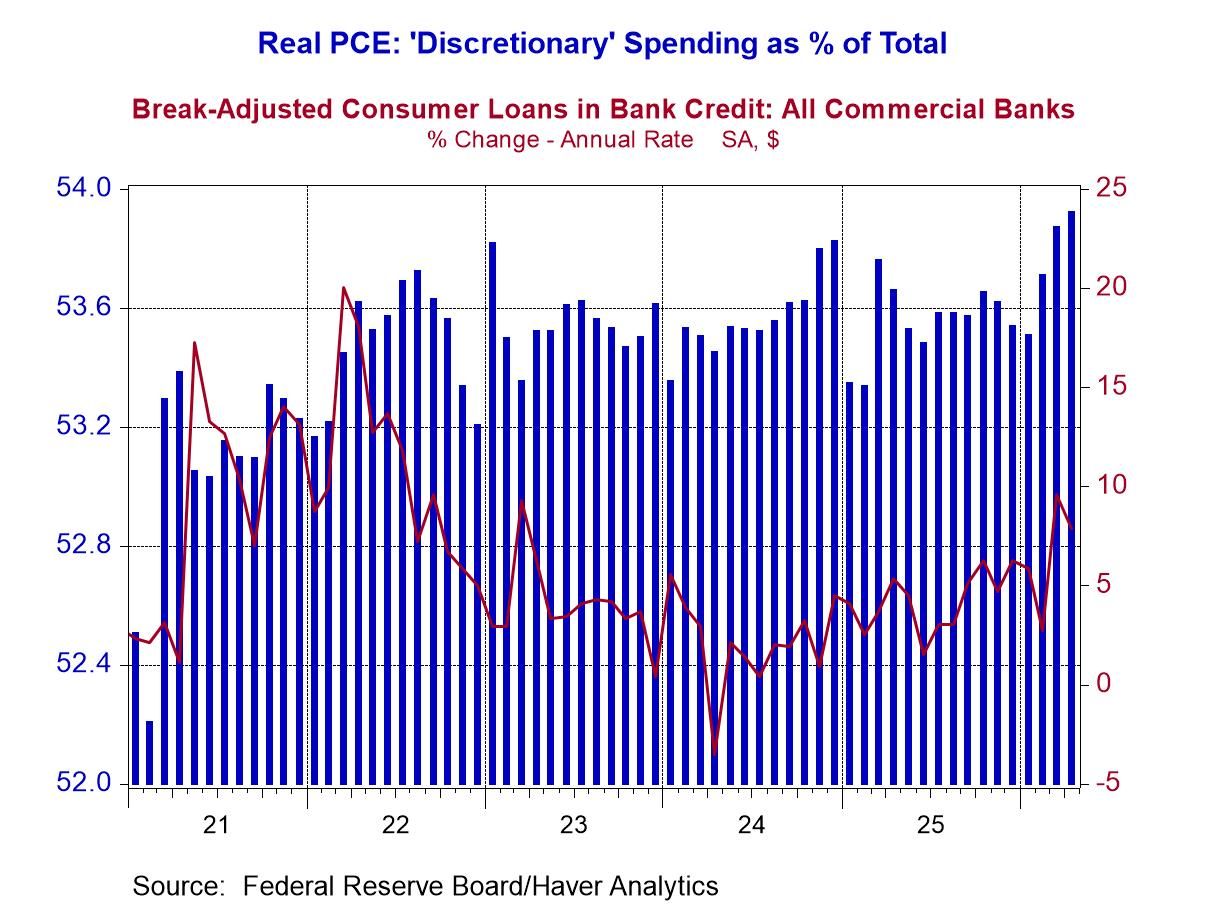
A possible explanation might be found in Chart 2, in which are plotted monthly observations of discretionary real personal consumption expenditures as a percent of total expenditures (the blue bars) along with the annualized month-to-month percentage changes in commercial bank consumer loans (red line). Notice that in March and April, growth in consumer loans granted by commercial banks picked up, growing annualized 9.6% in March and 7.9% in April. All else the same, when the banking system increases its lending to households, those households can increase their nominal spending whilst no other entity need cut back on its spending.
Chart 2
The legacy of Fed Chairman Arthur Burns is the concept of “core” inflation, i.e., the inflation rate when food and energy prices are excluded. Burns introduced this concept in 1972 and 1973 when food prices were rising in 1972 and energy prices were rising in 1973. Food prices were rising in 1972 because the anchovies did not show up on the coast of Peru due to a strong El Nino. Anchovies are converted into fishmeal for animal feed. By the way, a super El Nino is now being predicted for the coming months. Energy prices started rising in September 1973 because OPEC cut back on its production of oil in the wake of a war in the Middle East. History does tend to rhyme. Burns correctly argued that the 1972-73 rise in food and energy prices was due to negative supply shocks, and, thus was not the result of a too accommodative monetary policy. However, if the Fed wants to limit the persistence of higher inflation emanating from a negative supply shock, it might have to raise the federal funds rate in order to prevent an increase in bank lending. For example, in the face of today’s higher food and energy prices, households are having to devote more of their nominal income to nominal purchases of food and energy goods and services. In order to maintain their purchases on other goods and services, households are increasing their borrowing. If they did not borrow more, their purchases of nonfood and nonenergy goods and services would decline (or slow). In turn, this fall in demand for these other goods and services would impart downward pressure on “core” prices. So, while food and energy prices would rise, “core” prices would fall, or, at the very least, not rise. If “core” prices fell, the all-items price index might not rise. If “core” prices remained constant, the all-items price level would rise only because of the increase in food and energy prices. In order to discourage households (or businesses, for that matter, bank business loans have soared in recent weeks) from borrowing more from banks, the Fed might have to raise the federal funds rate. The Fed raising the federal funds rate in the face of negative-supply-shock-induced price increases would be about as politically popular as raising taxes on households any time. By the way, I just ran across a new “core” inflation concept today. It’s called the “super-core” inflation rate. The “super-core” is the price index for consumer services excluding food services, energy services AND housing services. The “Kasriel core” is all items excluding those whose prices increase! Perhaps I can sell this concept to Fed Chairman Warsh?
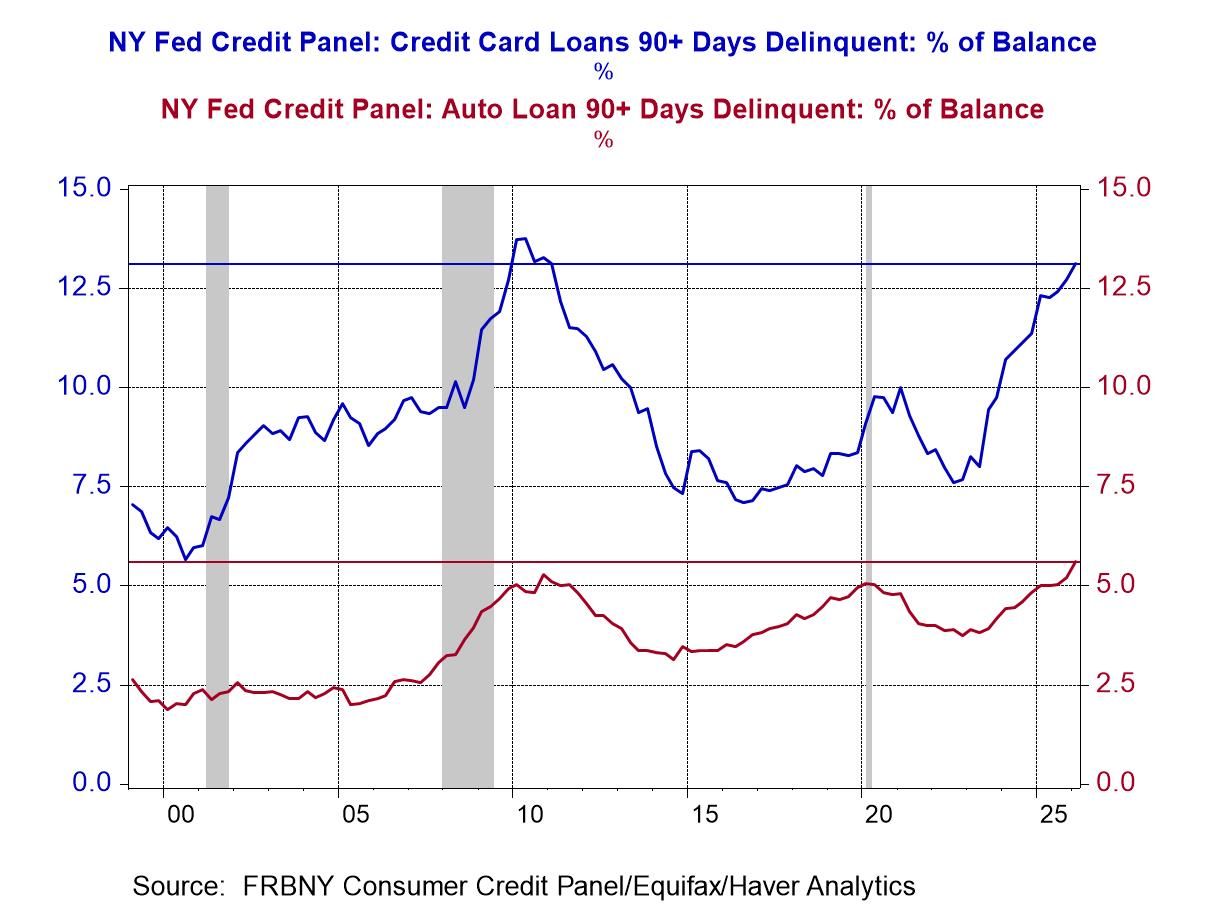
Of course, there is a limit to how much households can borrow in order to maintain their discretionary spending in the face of price increases of nondiscretionary goods and services. And that limit will be determined by bank loan officers as they get more concerned about loan defaults. Loan officers might soon start to get more concerned about household loan defaults. Plotted in Chart 3 are quarterly observations of the percentage of the outstanding balance of credit-card loans and auto loans that are 90+ days delinquent. The source of these data is a Federal Reserve Bank of New York quarterly survey. In 2026:Q1, the delinquency percentage for credit-card loans was 13.12%, just under the 2010 high of 13.74%. In 2026:Q1, the delinquency rate for auto loans was 5.60%, surpassing the 2010 high. So, perhaps the Fed won’t have to raise the federal funds rate to limit bank consumer loan growth? Perhaps, instead, bank loan officers will do the deed?
Chart 3

Paul L. Kasriel
AuthorMore in Author Profile »Mr. Kasriel is founder of Econtrarian, LLC, an economic-analysis consulting firm. Paul’s economic commentaries can be read on his blog, The Econtrarian. After 25 years of employment at The Northern Trust Company of Chicago, Paul retired from the chief economist position at the end of April 2012. Prior to joining The Northern Trust Company in August 1986, Paul was on the official staff of the Federal Reserve Bank of Chicago in the economic research department. Paul is a recipient of the annual Lawrence R. Klein award for the most accurate economic forecast over a four-year period among the approximately 50 participants in the Blue Chip Economic Indicators forecast survey. In January 2009, both The Wall Street Journal and Forbes cited Paul as one of the few economists who identified early on the formation of the housing bubble and the economic and financial market havoc that would ensue after the bubble inevitably burst. Under Paul’s leadership, The Northern Trust’s economic website was ranked in the top ten “most interesting” by The Wall Street Journal. Paul is the co-author of a book entitled Seven Indicators That Move Markets (McGraw-Hill, 2002). Paul resides on the beautiful peninsula of Door County, Wisconsin where he sails his salty 1967 Pearson Commander 26, sings in a community choir and struggles to learn how to play the bass guitar (actually the bass ukulele). Paul can be contacted by email at econtrarian@gmail.com or by telephone at 1-920-559-0375.