Global| Oct 22 2026
Charts of the Week: Growth on Borrowed Strength
by:Andrew Cates
|in:Economy in Brief
Summary
The global economy has proved remarkably resilient in the face of war, political uncertainty and persistently high borrowing costs. Yet resilience is not the same as strength. Growth has become increasingly dependent on a narrow investment boom, particularly in artificial intelligence, while its financial and physical costs are mounting. Last week's market retreat exposed the concentration of investor enthusiasm (chart 1), while Japanese exports revealed the growing importance of semiconductor investment to global industry (chart 2). Elsewhere, the picture is less reassuring. British wage disinflation appears to be stalling (chart 3), housing markets remain subdued (chart 4), and China's investment weakness has spread well beyond property (chart 5). Meanwhile, rising electricity prices point to another constraint on growth (chart 6). The underlying question is whether the investment sustaining the expansion can deliver sufficient productivity gains to justify its rising costs.
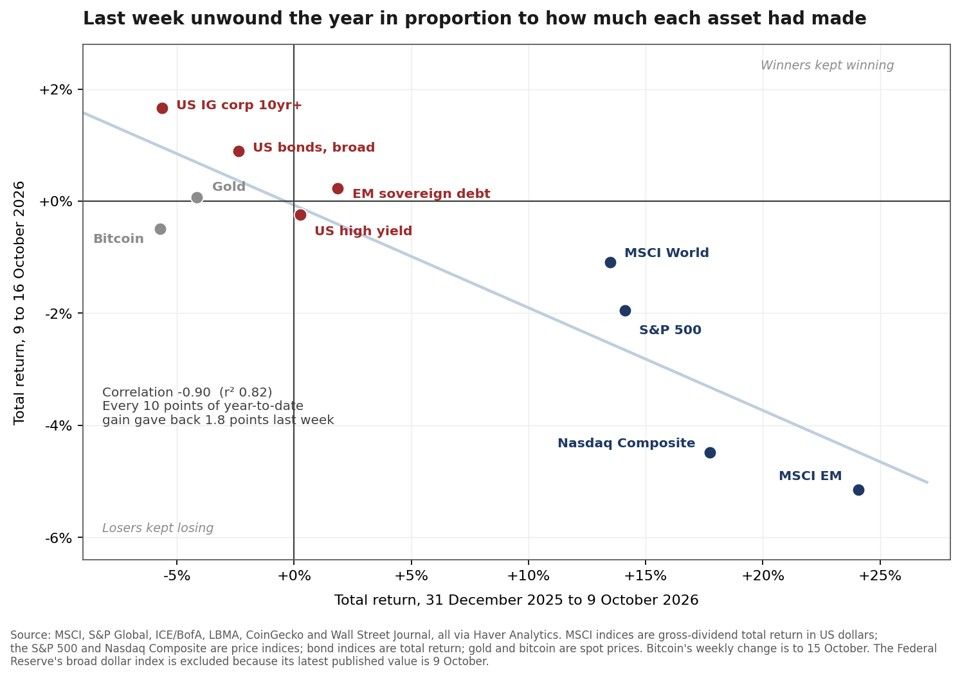
When the winners stumble The market retreat in the week to 16 October was striking for its pattern rather than its scale. Assets that had delivered the largest gains since the start of the year generally suffered the largest losses. For every ten percentage points of year-to-date gains, roughly 1.8 points were surrendered during the week (chart 1). Emerging-market equities and the Nasdaq were among the biggest casualties; broad US bonds and long-dated investment-grade credit edged higher. This looks more like a reversal of crowded positions than a wholesale reassessment of the economic outlook. But that distinction should not be too comforting. When market leadership is narrow, even modest doubts about its durability can prompt an outsized adjustment. Whether this episode proves fleeting will depend partly on the earnings and investment assumptions underpinning those earlier gains.
Chart 1: Last week’s losses tracked year-to-date gains across every asset class
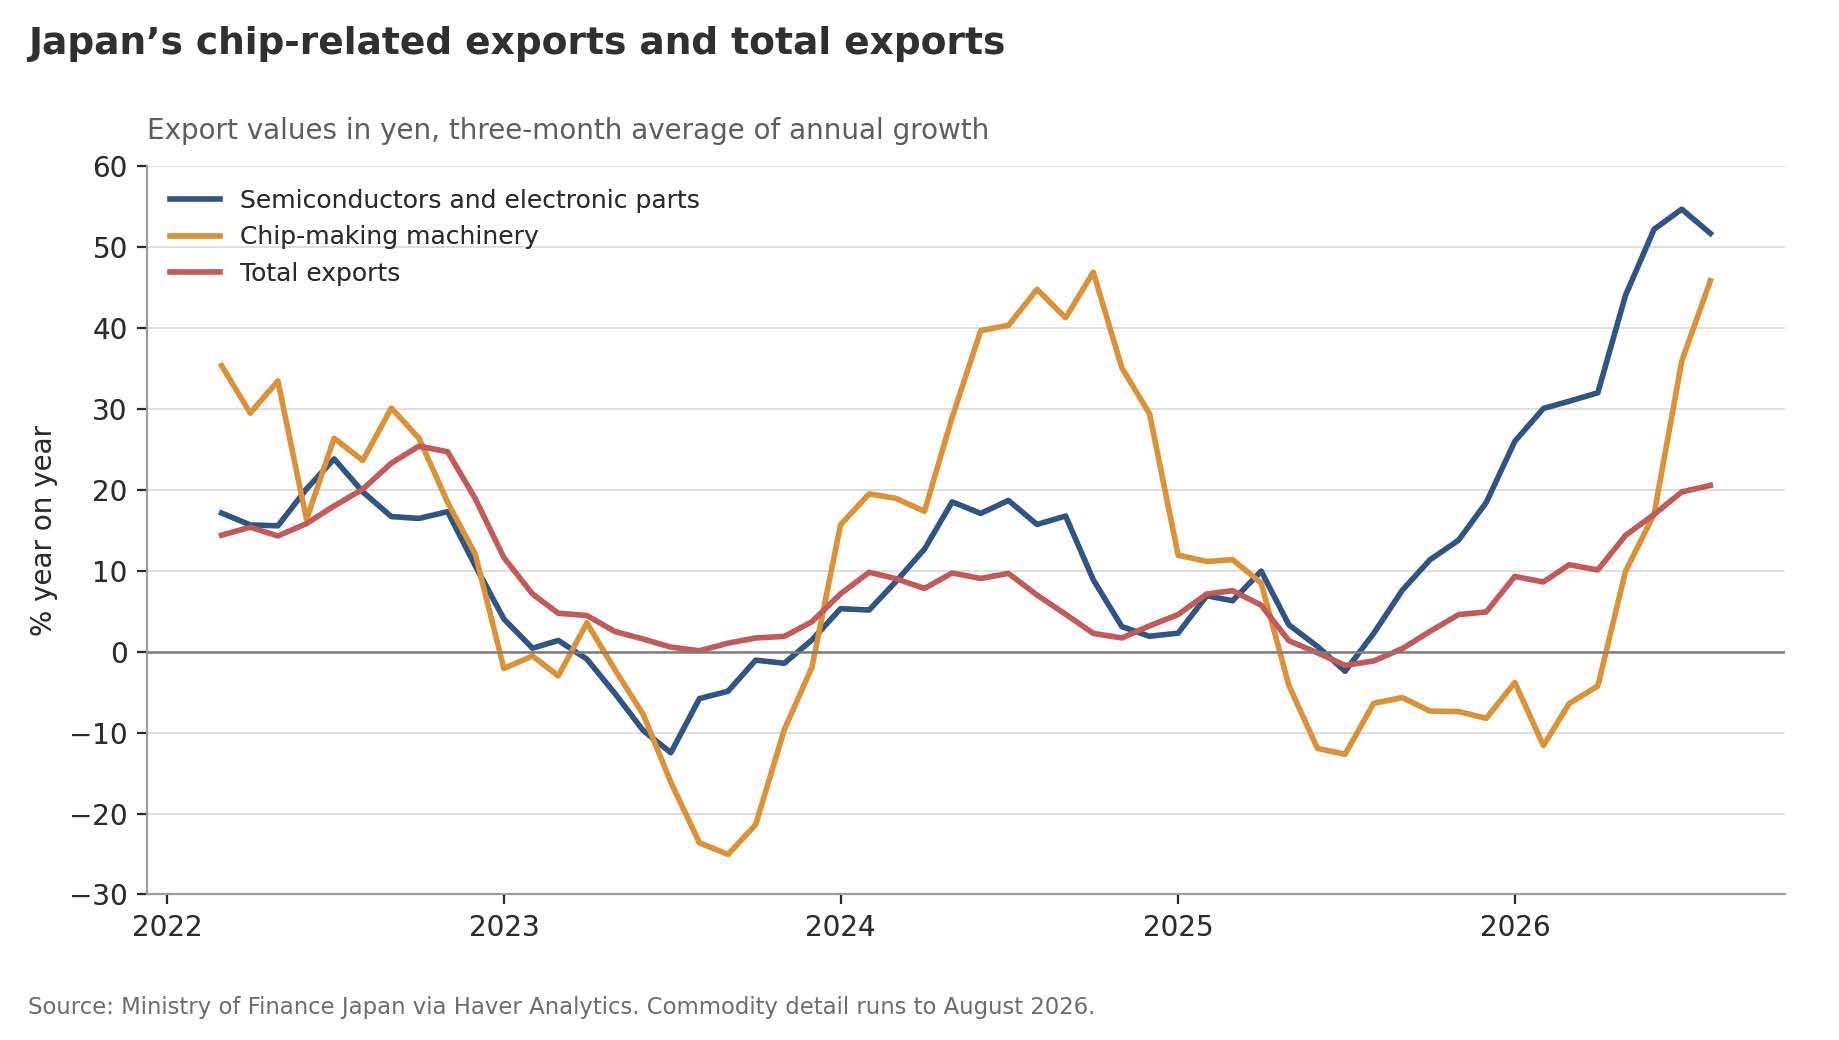
A global expansion with one powerful engine This week’s export data from Japan offer a revealing measure of the scale of the AI investment boom. Shipments of semiconductors and electronic parts are growing by more than 50% y/y, while exports of chip-making machinery have also surged. Total exports are rising at a much more modest pace (chart 2). Machinery exports are especially revealing: they reflect investment in future productive capacity, not merely demand for chips today. A weaker yen has inflated export values, but cannot plausibly explain the entire divergence. The strength of this investment cycle is real. So is its concentration. Much of the apparent resilience of global manufacturing now depends on the willingness of a relatively small number of firms to keep building computing capacity. The longer that continues, the more important the eventual returns on that investment become.
Chart 2: Japan’s chip-related exports and total exports
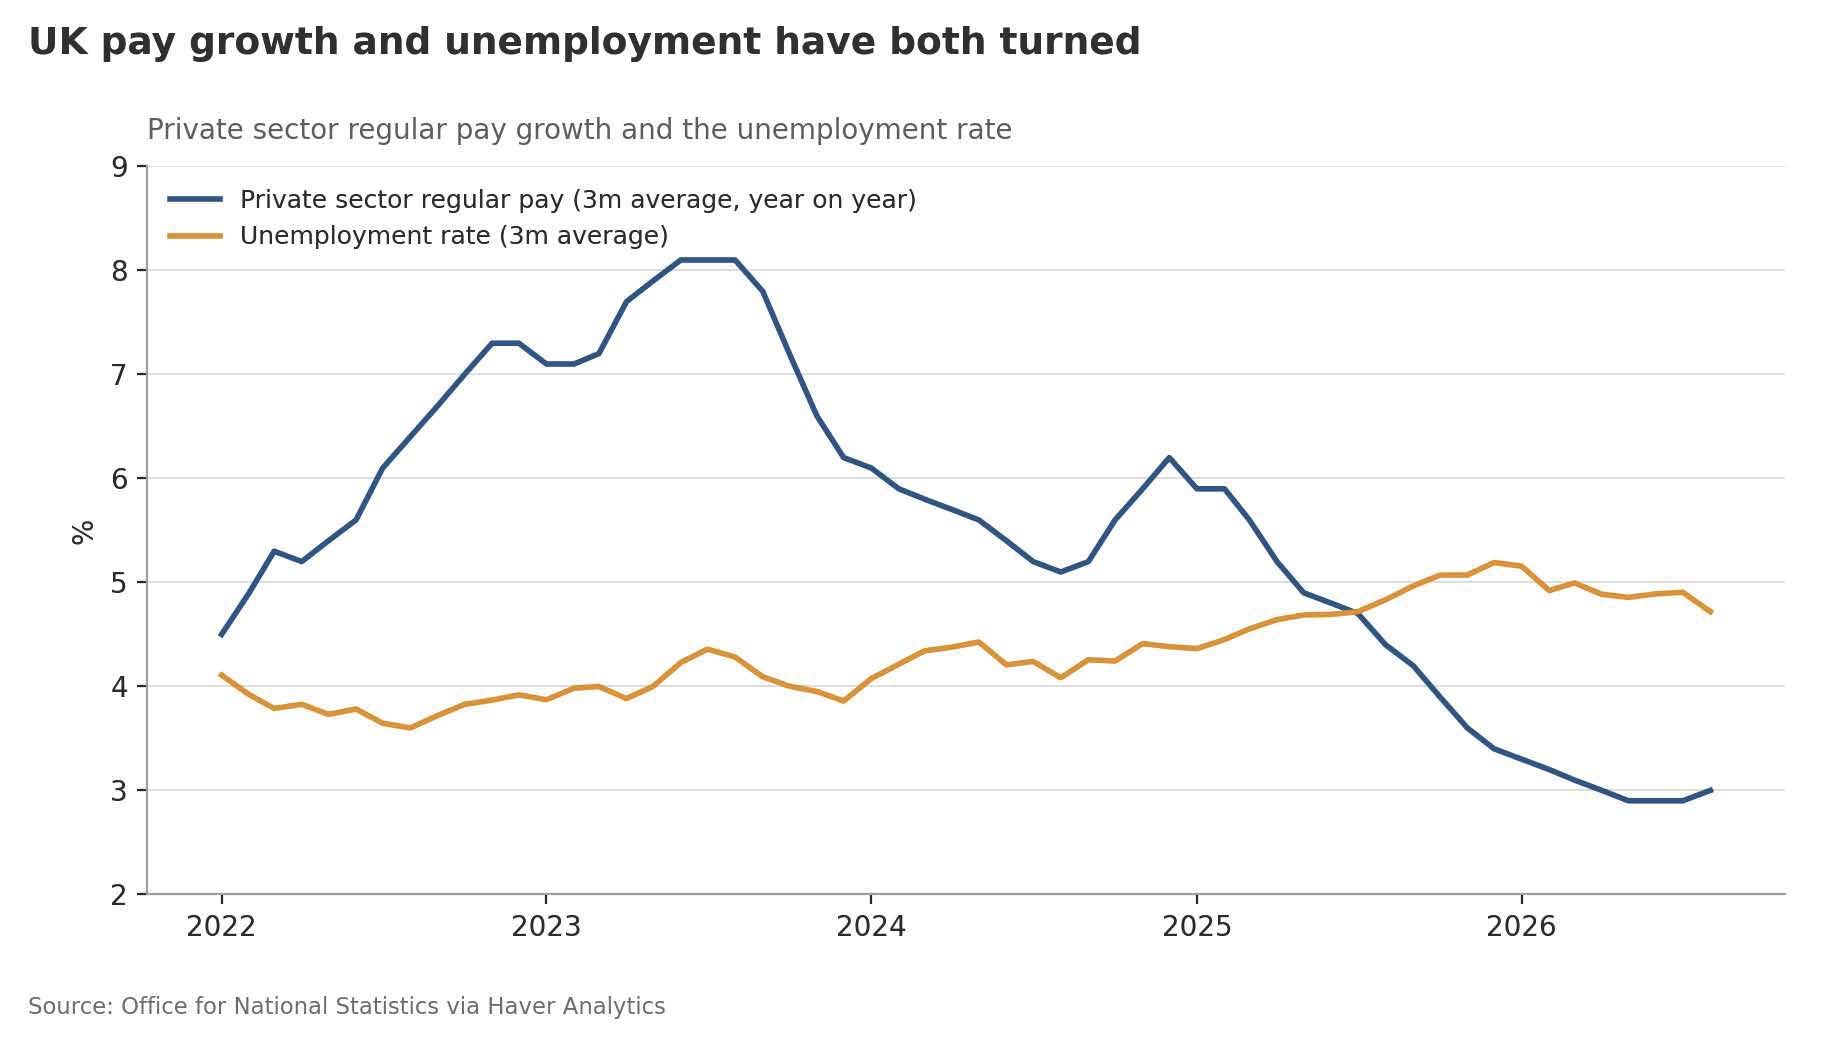
Britain’s awkward inflation arithmetic The latest UK labour-market figures complicate the outlook for inflation and interest rates. Private-sector regular pay growth, after slowing for much of the past two years, has levelled off at around 3% (3 month average, y/y) and edged higher in the latest monthly reading. Unemployment fell to 4.7% in the three months to August from 4.9 per cent in July, while payroll employment has recorded a modest increase (chart 3). Yet vacancies continue to decline, suggesting that demand for labour remains fragile. It would be premature to call this a renewed tightening of the labour market. Equally, the Bank of England cannot assume that wage disinflation will continue unaided. The uncomfortable possibility is that underlying pay pressures are proving sticky even as businesses remain reluctant to hire. That is precisely the combination that makes monetary policy difficult.
Chart 3: UK private sector pay growth and the unemployment rate
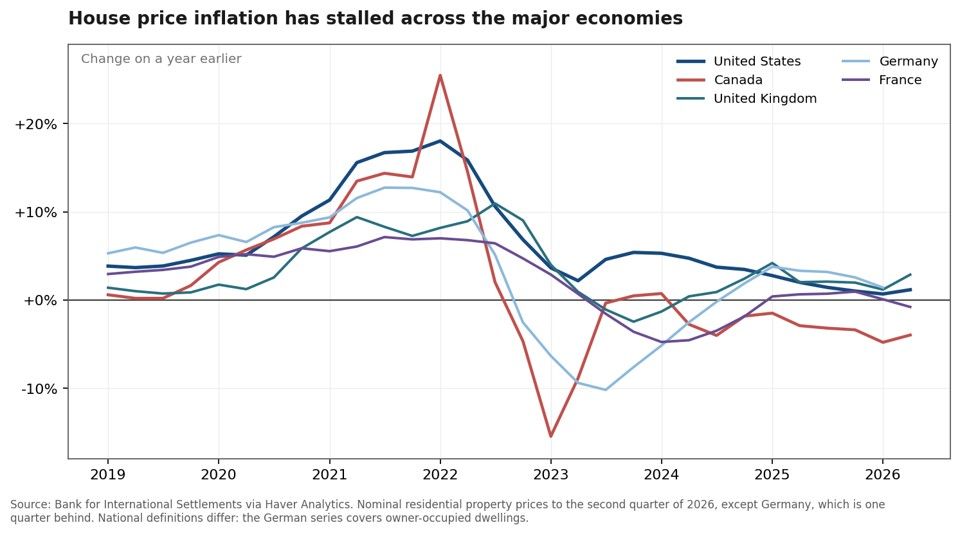
Housing bears the weight of high rates Across much of the advanced world, housing markets have reached a similar destination by different routes. Annual nominal house-price inflation has slowed to close to zero in the US, the UK, Germany and France; Canadian prices are still falling (chart 4). Adjusted for consumer-price inflation, all five markets are losing ground. Their mortgage systems, housing supply and ownership patterns differ substantially. What they share is a prolonged period of expensive finance. The consequences extend beyond homeowners’ paper wealth. Weaker housing markets weigh on construction, household confidence and the collateral available to support borrowing. They also constrain property-related tax revenues. Housing is one of the clearest channels through which more restrictive monetary conditions and higher bond yields are working. It helps explain why an economy that continues to grow can nevertheless feel sluggish to many households.
Chart 4: House price inflation has stalled across the major economies
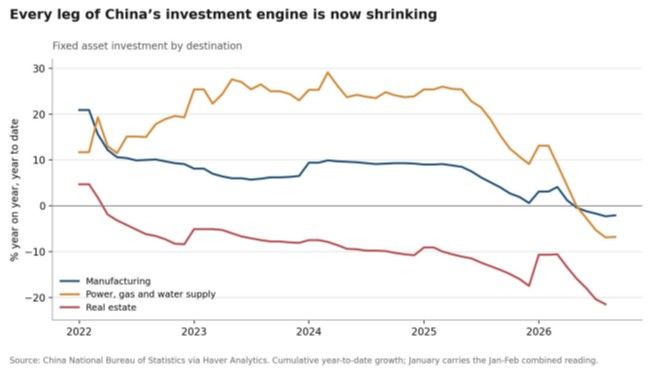
China’s investment problem deepens China’s latest figures this week challenge the idea that investment has simply migrated from property development to more productive industries. Real-estate investment is contracting by more than 20% y/y. Manufacturing investment has also turned negative, and investment in power, gas and water supply has followed it below zero after several years of rapid growth (chart 5). These are different sectors, with different drivers, but their simultaneous weakness is telling. Industrial production is still expanding by more than 5% y/y while retail sales are growing by barely 1%. China continues to produce far more vigorously than its households spend. That leaves growth dependent on exports at a time when trading partners are increasingly resistant to absorbing additional Chinese supply. For the rest of the world, the result is weaker Chinese demand alongside continued downward pressure on traded-goods prices.
Chart 5: China’s fixed asset investment by destination
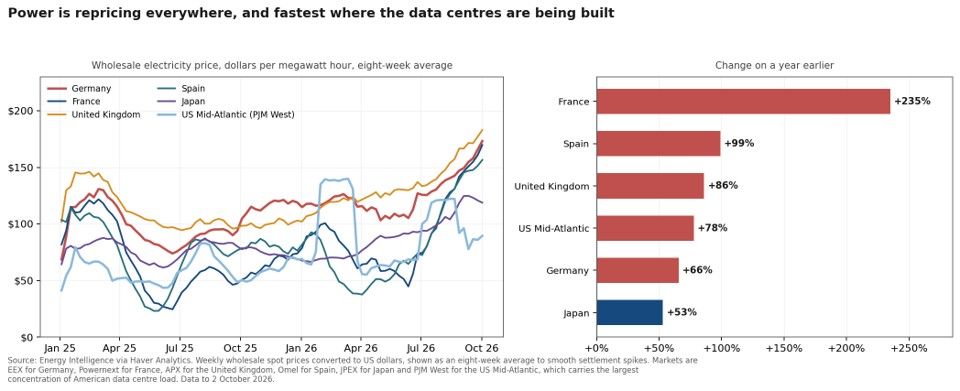
The rising cost of power Electricity has continued to emerge as a major constraint on the very investment boom that has helped sustain growth. Wholesale prices have increased sharply across major markets over the past year: French prices are more than three times their earlier level, those in Spain and the UK have roughly doubled, and prices in the US Mid-Atlantic market have risen by close to 80% (chart 6). The causes are not identical. French nuclear availability and Iberian hydrological conditions matter, as do local generation and transmission bottlenecks. It would be too simple to attribute every increase to data centres. Nevertheless, growing demand from electrification and computing is arriving faster than power systems can always accommodate. This matters well beyond the technology industry. Higher electricity costs squeeze households and energy-intensive businesses before any promised productivity dividend from AI becomes visible. The paradox of this expansion is becoming clearer: the investment intended to make economies more productive may, in the meantime, make them more expensive to run at least in the short term.
Chart 6: Wholesale electricity prices have risen across every major market

Andrew Cates
AuthorMore in Author Profile »Andy Cates joined Haver Analytics as a Senior Economist in 2020. Andy has more than 25 years of experience forecasting the global economic outlook and in assessing the implications for policy settings and financial markets. He has held various senior positions in London in a number of Investment Banks including as Head of Developed Markets Economics at Nomura and as Chief Eurozone Economist at RBS. These followed a spell of 21 years as Senior International Economist at UBS, 5 of which were spent in Singapore. Prior to his time in financial services Andy was a UK economist at HM Treasury in London holding positions in the domestic forecasting and macroeconomic modelling units. He has a BA in Economics from the University of York and an MSc in Economics and Econometrics from the University of Southampton.
More Economy in Brief