 Global| May 20 2021
The Case Against An Inflation Surge
by:Andrew Cates
|in:Viewpoints
Summary
Last week’s surprisingly big climb in April’s US CPI data has further energised a debate about inflation. In one corner of that debate are a majority of economic forecasters and policymakers. The view here is that any recent and [...]
Last week’s surprisingly big climb in April’s US CPI data has further energised a debate about inflation. In one corner of that debate are a majority of economic forecasters and policymakers. The view here is that any recent and prospective rise in inflation is apt to be temporary. Current price pressures are being driven by a combination of increased demand from an economic reopening and by rising commodity prices that are, in turn, being amplified by shortages of materials. This mismatch between demand and supply though ought to close as lockdown restrictions are loosened. Capacity, in other words, should respond to firmer demand.
However, the case for a temporary rise in inflation seems stronger - to this scribe - for now. The reasons for this are as follows:
• Inflation over-shoots – one source of the recent angst - are not yet broadly based. They are confined to a few specific sectors and to just one or two major economies.
• A trend toward positive inflation surprises moreover is – as is the norm - being partly driven by rising commodity prices (alongside base effects from last year’s falling commodity prices). This rise though has all the hallmarks of a relative - not an absolute - shift in prices. Absolute shifts though are the stuff of an enduring inflation problem.
• Wage pressures – which are critical for second round effects – are notable by their absence at present particularly when we adjust for productivity growth. And it is these unit wage costs pressures (i.e. wage inflation adjusted for productivity) that are more important for the inflation equation than, say, nominal wage growth in isolation.
• While the current loose stance of monetary policy is admittedly more concerning, and seems to be generating very robust domestic money supply growth in the US at present, the links between that growth and inflation are tenuous. Moreover, global monetary trends matter more these days than domestic trends. And global monetary matters seem far more benign than US money supply matters.
• There is empirical foundation for the idea that ageing demographics is an important structural restraint for consumer price inflation. And that ageing demographic factor is apt to be more, not less, of a restraint on inflation for most major economies in the period ahead.
In what follows we briefly discuss the evidence for these views with reference to a few charts.
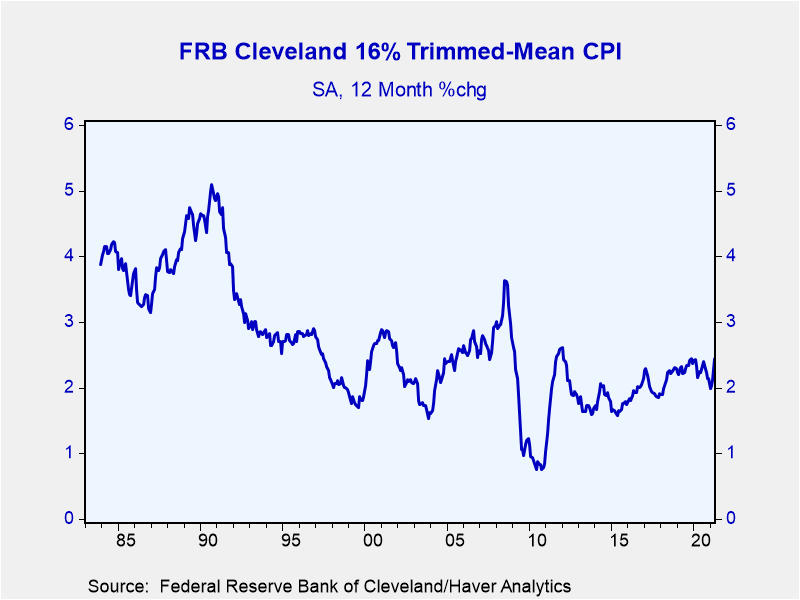
We start with recent US inflation trends, which, as noted above, have been a key source of the heightened anxiety in financial markets of late. Specifically, last week’s data showing a 4.2% y/y gain in April’s headline CPI inflation and a 3.0% gain in core inflation scattered inflation alert seeds not least because both data points were a good 0.6 percentage points above economists’ expectations. Inflation doves, however, could find crumbs of comfort in these data. Most noteworthy to this observer was the absence of inflation breadth. Nearly 60% of the month-on-month climb in US headline CPI in April was comprised of just five components – used cars, rental cars, lodging, airfares and food away from home. Therefore, inflation metrics that exclude these outliers – such as the Cleveland Fed’s trimmed mean index - show much tamer increases in prices (see figure 1 below).
Figure 1: US Trimmed Mean CPI inflation is still tame
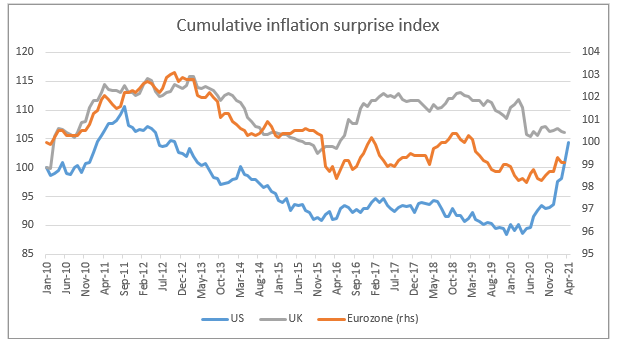
Just though as the sectoral details sound fewer inflation alarm bells than the aggregate US figuring so too do the latest country-level data in the global inflation story. In figure 2 below we have illustrated some newly calculated cumulative inflation surprise indices for the US, Euro area and the UK. These indices track the tendency of incoming inflation data – consumer prices, producer prices and import and export prices – to deviate from the published high frequency consensus. A rising trend suggests a persistent tendency from incoming data to surprise forecasters on the upside. Equally, a declining trend reveals a persistent undershoot from incoming inflation data relative to consensus. As figure 2 further suggests, though a rising trend in recent weeks has - on the whole - been somewhat narrowly confined to the US. The Eurozone has admittedly seen a modest step up in its cumulative index though this pales into insignificance relative to the rise in the US. The UK in the meantime has seen its cumulative surprise index moderate. For the record – while not illustrated in figure 2 as these indices are not as easy to calculate for most countries - a similarly benign message can be gleaned from the recent CPI dataflow relative to forecasts from China and Japan as well.
Figure 2: Cumulative inflation surprise index for the US, Euro area and the UK
Source: Action Economics, Informa Global Markets, Haver Analytics Calculations. Based on Median Forecasts and Actual Outcomes for Consumer prices, Producer prices and Import and Export prices (US only). The aggregate monthly deviation in outcomes from forecasts is cumulated from January 2010.
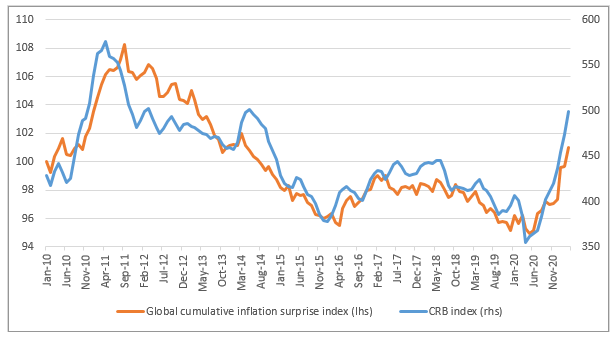
Of course this doesn’t preclude any step up in these inflation surprise indicators in Europe (and Asia) in the period ahead. In fact, a step up seems more than likely based on what we know about why inflation surprises have evolved in the past. Speciifically it has been rising commodity prices that typically elicit positive inflation surprises (and vice versa). This is evidenced in figure 3 below in which we have illustrated a global aggregation of the inflation surprise indices in figure 2 above and compared this with a generic commodity price index (the CRB index). The close relationship between these two indicators - the correlation coefficient is 89% - suggests that commodity prices are usually at the root of inflation forecast errors. It further suggests, given the lags beween commodity price data (daily observations) and European (and Asian) inflation data (monthly observations and published 2 to 3 weeks after the end of the month to which they pertain), that positive surprises are in store for the eurozone and the UK (and possibly Asia as well) in the weeks ahead.
Figure 3: Cumulative global inflation surprise index versus the CRB index
Source: Action Economics, Informa Global Markets, Haver Analytics Calculations. Based on Median Forecasts and Actual Outcomes for Consumer prices, Producer prices, and Import and Export prices (US only). The aggregate monthly deviation in outcomes from forecasts is cumulated from January 2010. The global aggregation is based on a weighted sum of the index for the US, Euro area and UK with respective weights of 0.5, 0.35 and 0.15.
But are rising commodity prices and positive inflation surprises symptomatic of a more permanent increase in inflation? Straightforward economic theory would suggest not. A commodity price rise driven by, say, supply shortages or by a step-up in commodity demand is a relative price shock. Unless ‘accommodated’ and ‘reinforced’ by, say, rising wages and profits, this will erode an economy’s purchasing power, unless the economy is a major producer of commodities.
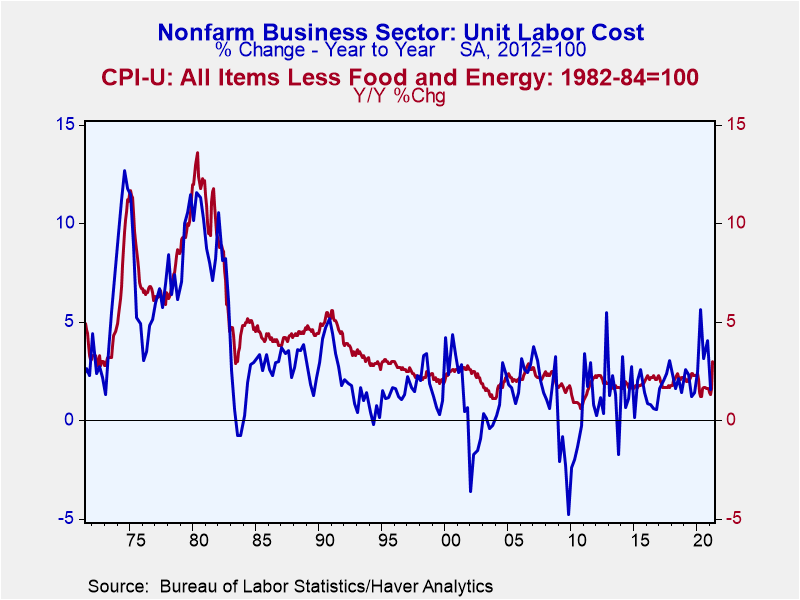
This brings us neatly though onto the important question of wage inflation. While it’s true that some wage inflation metrics have climbed a little in some countries and could climb a little further as labour markets tighten, the key for broader inflation tension concerns productivity growth. And for the US there is ample evidence at present to suggest that firmer productivity growth is offsetting firmer nominal wage inflation. In other words, unit wage cost inflation is under wraps. As figure 4 below further suggests it is unit wage cost inflation, notwithstanding its volatility, that holds the key for broader inflationary pressures.
Inflation hawks can of course counter that there are no guarantees that unit wage cost inflation will remain under wraps not least because companies are increasingly reporting labour shortages. Much will hinge here though on how productivity now evolves. Putting that another way will labour markets now become more flexible in a post-pandemic world as automation, other new technologies and changing business models generate a change in behaviour?
Figure 4: US unit labor cost inflation versus core CPI inflation
While firmer (unit) wage cost inflation is a sufficient condition for accommodating relative price shocks, loose monetary policy is arguably a more necessary condition. And there is no question that monetary backdrop in most major economies is exceptionally loose, indeed highly unusual. Demand deposits are booming in the many of these same economies and M2 growth is – accordingly – has been exceptionally strong. It would be somewhat churlish to ignore this signal and counter that these growth rate somehow does not matter.
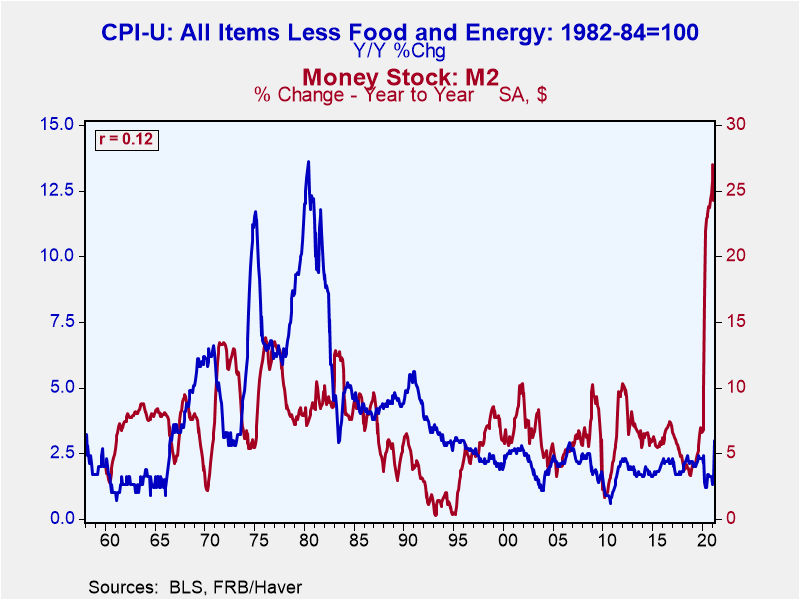
Still, there are empirical grounds for thinking that it might not matter as much as it used to. For the links between domestic monetary growth and domestic inflation have broken down, indeed the underlying correlations have been close to negligible for a long period of time (see figure 5 below for the US). The globalisation of finance, the increasing sophistication of the financial sector including via off-balance sheet financing have been some of the reasons.
Figure 5: US M2 growth versus core CPI inflation
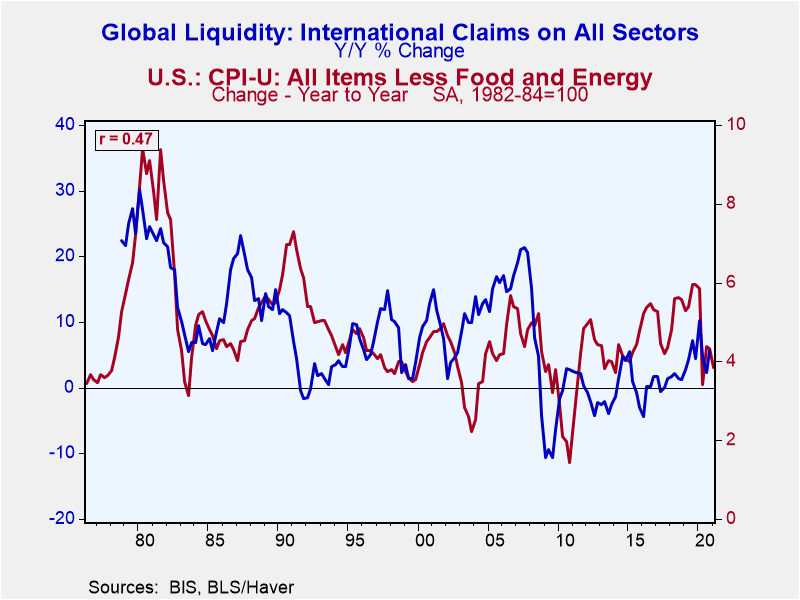
This in turn has meant that global monetary/liquidity indicators are arguably of more relevance for domestic inflation generation than they use to be (see figure 6 below). And while global liquidity growth is admittely very tough to measure, indicators that purport to give it some context are presently far more benign than most domestic monetary growth rates for the major economies.
Figure 6: Global liquidity growth versus US core CPI inflation
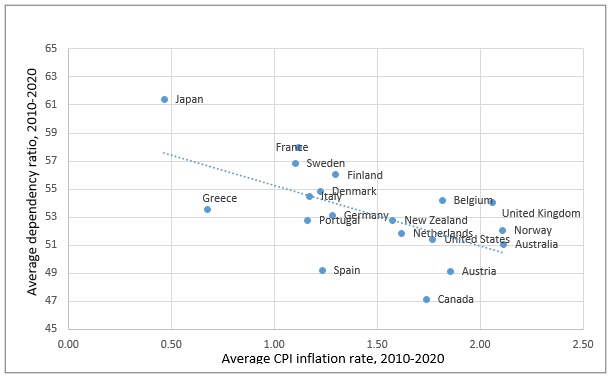
A final factor that is arguably of relevance to the current debate concerns demographics. Ageing demographics have tended to go hand in hand with weaker inflation outcomes. Japan’s experience in recent decades is the classic example of this. But at a broader international level we can see this at play empirically in figure 7 below. This chart shows 10 years averages for dependency ratios – the ratio of the non-working age population to those of working age – plotted against average levels of CPI inflation. It suggests that older economies in the north-west corner of the chart have typically experienced weaker inflation rates relative to younger economies in the south-east corner. Reduced dynamism, weaker household and business credit formation, alongside a weaker appetite from the old for higher inflation have conspired to deliver lower inflation. And with the world economy in general now confronting an ageing demographic profile and its major economies in particular (including China) this ought to continue to structurally restrain inflation expectations and compress any climb in wage and price inflation in the period ahead.
Figure 7: Average dependency ratios (demographics) versus average inflation rates, 2010-2020
Source: United Nations/Haver Analytics.
Viewpoint commentaries are the opinions of the author and do not reflect the views of Haver Analytics.Andrew Cates
AuthorMore in Author Profile »Andy Cates joined Haver Analytics as a Senior Economist in 2020. Andy has more than 25 years of experience forecasting the global economic outlook and in assessing the implications for policy settings and financial markets. He has held various senior positions in London in a number of Investment Banks including as Head of Developed Markets Economics at Nomura and as Chief Eurozone Economist at RBS. These followed a spell of 21 years as Senior International Economist at UBS, 5 of which were spent in Singapore. Prior to his time in financial services Andy was a UK economist at HM Treasury in London holding positions in the domestic forecasting and macroeconomic modelling units. He has a BA in Economics from the University of York and an MSc in Economics and Econometrics from the University of Southampton.


