 Global| Sep 13 2007
Will Gasoline Prices Continue to Fall?
by:Tom Moeller
|in:Economy in Brief
Summary
U.S. retail gasoline prices have fallen 47 cents, or 15%, from the recent high of $3.22 in the middle of May. Momentum counts for something, but do the fundamentals behind gasoline prices argue for continued declines? The answer is a [...]
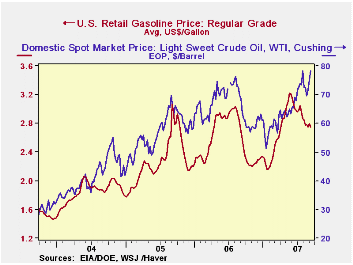
U.S. retail gasoline prices have fallen 47 cents, or 15%, from the recent high of $3.22 in the middle of May. Momentum counts for something, but do the fundamentals behind gasoline prices argue for continued declines? The answer is a clear "no."
First off, there's that spike in crude oil prices to roughly $80 per barrel. That is up 15% from the very recent low of $70 per barrel in early August.
Higher feedstock prices seem to suggest that retail prices will rise.
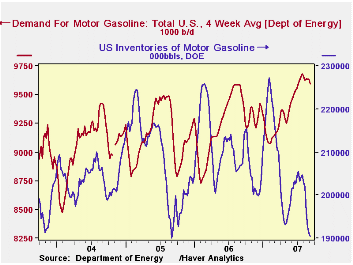
Easier demand for gasoline also contributed to the gasoline price drop. That decline could continue given that gasoline prices still are up nearly 20% from yearend '06, but that is the only (somewhat flimsy) reason to expect price declines to continue.
Other fundamentals suggest higher gasoline prices, and one is the low state of gasoline inventories. Gasoline inventories are down 16% this year and most recently have slipped 7% after a brief rebuilding this past Spring and early Summer.
Lower U.S. production of gasoline and lower imports of petroleum products which usually would lift inventory did not stem the inventory decline.
So it is the combination of higher crude oil prices and lower gasoline inventories that suggest a rise gasoline prices, and possibly soon. The good, but hardly great, news is that the rise will come from a level of gasoline prices relative to all other prices which is down roughly 39% from the high in 1980.
Energy statistics are available daily in Haver Analytics' DAILY database, weekly in WEEKLY and OILWKLY, monthly/quarterly in USECON and OGJ, and annual in OGJANN. Data from Energy Intelligence are also available in OMI, NGW and WGI.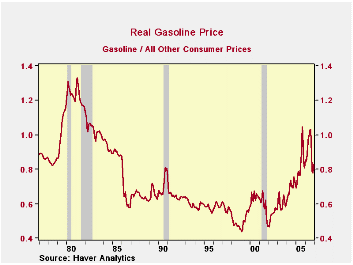
by Carol Stone September 13, 2007
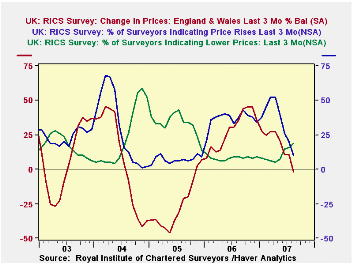
The UK housing market, too, seems to be faltering. The monthly survey of the Royal Institute of Chartered Surveyors, RICS, shows a net decline in house prices in its August reading of -1.8%, the first decline since October 2005. The survey questions asks about developments over the past three months, so this is no quirk. The raw data show a drop from 20% in July to 10% in August in the portion of RICS members reporting higher home prices and an increase from 16% to 19% in the portion reporting lower prices. [Net balance figures are seasonally adjusted by RICS.]
In August, the average number of home sales per surveyor was 23.3 over three months. The average number of homes in their inventory at the end of August was 62.2, making a turnover ratio of 37.6%. While this is almost the same as in August 2006, it is down from a recent high of 46.6% in March.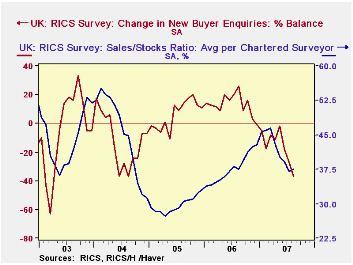
Further, buyer enquiries were reduced at a net 37% of firms, a deterioration from July's 27% and June's 19%. The raw response data showed a lower volume of enquiries at 61% of firms, the highest figure for August since 2004, which was 62%, the highest August value in the nine-year history of the survey.
A separate report from the UK Government's Department of Trade and Industry shows that orders for construction have already weakened. They fell 7.5% in July, following on 16.0% in June (seasonally adjusted in 2000 prices). These orders move widely from month to month, and looking at a 2-month % change gives an average of -11.9% in June and July, the weakest period since May/June 2003, -12.2%. Orders for new housing rose in July, by 15.7%, but they had dropped 32.7% in June. The two months had an average decline of 11.8%, the weakest performance since September/October 2001. Nonresidential construction orders, called here "other work", fell 15.3% in July and 8.4% in June.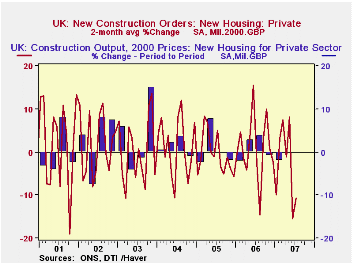
Construction output is measured in the UK in quarterly data, reported for Q2 just a week ago. It looked pretty good. The total, "all work", rose 0.8% from Q1 and 3.5% from a year ago. This was the strongest outcome since Q2 2004. However, the housing portion has already flattened out. New private housing output was virtually unchanged in Q2 after declining 2.1% in Q1; the year-on-year change showed modest growth of 1.1%. Obviously the customer traffic reported in the RICS survey and the downward path of orders for new housing don't suggest that an improvement is imminent.
| UK: RICS Survey, SA | Aug 2007* | July 2007* | June 2007* | Year Ago* | 2006 | 2005 | 2004 |
|---|---|---|---|---|---|---|---|
| House Prices: % Balance | -1.8 | +10.8 | +10.7 | +36.2 | +28.3 | -25.9 | +6.8 |
| Sales/Stock Ratio, % | 37.5 | 37.1 | 39.1 | 37.7 | 37.7 | 29.7 | 45.3 |
| New Buyer Enquiries % Balance |
-37 | -27 | -19 | +26 | +13 | +6 | -12 |
| SA*, % Change | |||||||
| Construction Orders | -- | -7.5 | -16.0 | -3.7 | +6.0 | +6.0 | +8.3 |
| New Housing | -- | +15.7 | -32.7 | -0.3 | +1.7 | +4.7 | +15.2 |
| Other Work | -- | -15.3 | -8.4 | -5.2 | +8.0 | +6.6 | +5.4 |
by Tom Moeller September 13, 2007
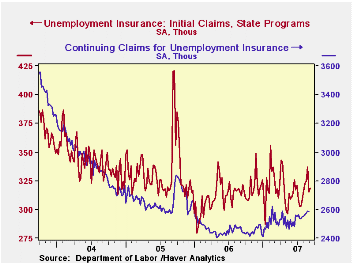
Initial claims for unemployment insurance rose a bit last week, but only by 4,000 to 319,000. A much larger increase to 325,000 had been expected by a Consensus of economists that would have reversed roughly half of the prior week's 22,000 decline. The prior week's figure was revised down slightly to 315,000.
A claims level below 400,000 typically has been associated with growth in nonfarm payrolls. During the last six years there has been a (negative) 78% correlation between the level of initial claims and the m/m change in nonfarm payroll employment.
The four-week moving average of initial claims fell slightly to 324,000 (2.7% y/y).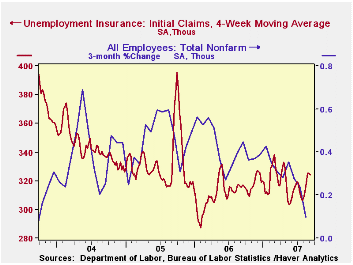
Continuing claims for unemployment insurance fell by 6,000, reversing one third of the prior week's large 18,000 increase. That rise was revised lower from a 25,000 gain reported initially. The continuing claims numbers lag the initial claims figures by one week.
Since yearend 2006, continuing claims have risen 173,000 or by 7.2%
Payroll employment has risen 870,000 (0.6%) since yearend.
The insured rate of unemployment was unchanged at 2.0%.
The Rise in U.S. Household Indebtedness: Causes and Consequences from the Federal Reserve Bank can be found here.
| Unemployment Insurance (000s) | 09/08/07 | 09/01/07 | Y/Y | 2006 | 2005 | 2004 |
|---|---|---|---|---|---|---|
| Initial Claims | 319 | 315 | 2.2% | 313 | 331 | 343 |
| Continuing Claims | -- | 2,585 | 4.2% | 2,545 | 3.3% | 2,459 |
by Robert Brusca September 13, 2007
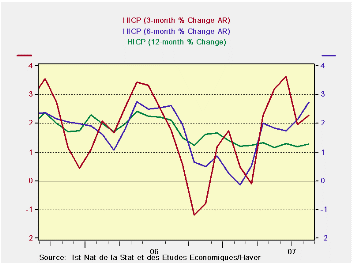
France’s HICP is below 2% Y/Y at a 1.3% pace. It has since, in shorter periods of six months and three months, shown some upward pressure. The HICP core for August is not yet available, but it too has showed some pressure in recent months. France’s own core CPI is an example as it is up by 0.4% in August. It is up by 1.5% Y/Y. Still, over three and six months, its pace is in the 2.2% to 2.3% range. That is not horrible but it is above the ECB ceiling rate of 2%.
The red figures in the table below identify categories where inflation has accelerated relative to the previous period. (three months compared to six months; six months compared to year over year etc). They show that over six months inflation has heated up. And even with that, compared to six month ago three-month trends are somewhat mixed but still elevated themselves, on balance.
Inflation over twelve months is lower than it was over the previous 12 months. The diffusion readings at the table bottom underscore what the headlines for inflation tell us on that score. The diffusion reading scans the 12 main CPI categories for trends; it finds inflation sharply higher over six months compared to 12 months in most CPI categories. It also finds it only slightly more elevated over three months than over six months. Diffusion readings above 50% indicate acceleration; below 50%, deceleration. Diffusion measures the breadth of inflation, not its intensity.
Prices for alcohol and food are strong as well for restaurants and hotels. The ECB already is wary of food prices. France does seem to be experiencing some really strong pressure in inflation, though nothing terribly virulent.
| Mo/Mo % | Saar % | Yr/Yr | |||||
| Aug-07 | Jul-07 | Jun-07 | 3-Mo | 6-Mo | 12-Mo | Yr Ago | |
| HICP Total | 0.3% | 0.0% | 0.2% | 2.3% | 2.7% | 1.3% | 2.1% |
| Core | #N/A | 0.0% | 0.1% | #N/A | #N/A | #N/A | 1.4% |
| CPI | |||||||
| All | 0.3% | 0.1% | 0.2% | 2.3% | 2.5% | 1.2% | 1.9% |
| CPI excl Food & Energy | 0.4% | 0.1% | 0.1% | 2.3% | 2.2% | 1.5% | 1.4% |
| Food | 0.7% | -0.2% | 0.5% | 4.4% | 3.2% | 1.2% | 2.4% |
| Alcohol | 2.9% | 0.3% | 0.4% | 15.4% | 9.5% | 3.3% | 0.2% |
| Clothing & Shoes | 0.3% | -0.7% | 0.2% | -1.0% | 4.1% | 0.7% | -0.1% |
| Rent & Utilities | 0.1% | 0.2% | 0.5% | 3.0% | 2.8% | 2.3% | 4.7% |
| Health Care | 0.1% | 0.4% | 0.0% | 1.9% | 0.4% | 0.2% | 0.2% |
| Transport | -0.4% | 0.2% | 0.4% | 0.6% | 4.3% | 1.0% | 3.5% |
| Communication | 0.5% | 0.0% | -0.1% | 1.6% | -1.5% | 0.9% | -7.0% |
| Recreation & Culture | -0.1% | -0.2% | 0.1% | -1.0% | -0.5% | -1.9% | -0.5% |
| Education | 0.1% | 0.2% | 0.2% | 2.4% | 2.5% | 2.3% | 2.8% |
| Restaurant & Hotel | 0.8% | 0.5% | 0.3% | 6.8% | 4.8% | 3.0% | 2.4% |
| Other | 0.1% | 0.0% | 0.1% | 0.7% | 1.8% | 2.0% | 3.0% |
| Diffusion | -- | -- | -- | 54.5% | 81.8% | 36.4% | -- |
| Type: | Diffusion: Compared to | 6-mo | 12-mo | Yr-Ago | -- | ||
by Robert Brusca September 13, 2007
Italy shows Yr/Yr inflation trends that are under the ECB’s ceiling pace, at 1.7% compared to a 2% ceiling. The HICP is contained below 2% for both the 3-month and 6-month periods. But for Italy’s national inflation measure inflation is showing a bit more kick. Its overall inflation rate on its national measure is 1.6% y/y, the same as for its ex-tobacco reading. But over three and six months, inflation is in the 2% to 2.5% range with both measures accelerating to 2.5% over three months.
Even so, Italy’s diffusion measures do not confirm that this is much of an issue. For three months diffusion, which looks at the breadth of these trends, finds inflation to be accelerating in as many categories as it is decelerating with a neutral 50% diffusion reading. Over 6 months, diffusion is higher at 58.3%, but that is still not an enormous reading. Even with that diffusion reading national ‘headline’ inflation for 6 months is at 2% largely because one of the falling categories for inflation, communications, saw prices fall at an outsized 12.7% (annual rate).
While Italy may have some of the same lurking inflation France has reported, the trends do not seem to be as entrenched. In terms of the HICP measure, the one we care for the most, inflation is still in very good shape. In these numbers we are probably seeing some of the impact of Italy’s weak economy.
| Mo/Mo % | Saar % | Yr/Yr | |||||
| Aug-07 | Jul-07 | Jun-07 | 3-Mo | 6-Mo | 12-Mo | Yr Ago | |
| HICP Total | 0.2% | -0.1% | 0.3% | 1.5% | 1.6% | 1.7% | 2.3% |
| Core | #N/A | 0.0% | 0.1% | #N/A | #N/A | #N/A | 1.6% |
| CPI | |||||||
| All | 0.1% | 0.2% | 0.3% | 2.5% | 2.0% | 1.6% | 2.2% |
| CPI ex Tobacco | 0.1% | 0.3% | 0.2% | 2.5% | 2.0% | 1.6% | 2.1% |
| Food | 0.4% | 0.4% | 0.1% | 3.5% | 2.9% | 2.4% | 2.2% |
| Alcohol | 0.6% | -0.7% | 0.4% | 1.4% | -0.2% | 2.3% | 5.1% |
| Clothing & Shoes | 0.2% | 0.2% | 0.1% | 1.5% | 1.2% | 1.3% | 1.2% |
| Rent & Utilities | 0.2% | 0.0% | 0.3% | 2.2% | 0.7% | 1.2% | 6.1% |
| Housing &Furniture | 0.2% | 0.2% | 0.2% | 2.5% | 3.5% | 2.7% | 1.6% |
| Health Care | 0.2% | 0.1% | -0.2% | 0.0% | 0.2% | -0.1% | -0.1% |
| Transport | -0.7% | 0.6% | 0.9% | 3.0% | 4.7% | 1.4% | 3.3% |
| Communication | 0.0% | 0.0% | -1.0% | -3.9% | -12.7% | -8.4% | -4.1% |
| Recreation &Culture | 0.3% | 0.1% | 0.2% | 2.7% | 0.3% | 1.0% | 0.5% |
| Education | 0.1% | 0.2% | 0.2% | 2.4% | 2.7% | 2.1% | 3.0% |
| Restaurant & Hotel | 0.3% | 0.3% | 0.3% | 3.9% | 4.2% | 3.2% | 2.2% |
| Other | 0.3% | 0.2% | 0.1% | 2.3% | 3.2% | 2.3% | 2.9% |
| Diffusion | 50.0% | 58.3% | 41.7% | ||||
| Diffusion: Compared to | 6-mo | 12-mo | Yr-Ago | ||||

Tom Moeller
AuthorMore in Author Profile »Prior to joining Haver Analytics in 2000, Mr. Moeller worked as the Economist at Chancellor Capital Management from 1985 to 1999. There, he developed comprehensive economic forecasts and interpreted economic data for equity and fixed income portfolio managers. Also at Chancellor, Mr. Moeller worked as an equity analyst and was responsible for researching and rating companies in the economically sensitive automobile and housing industries for investment in Chancellor’s equity portfolio. Prior to joining Chancellor, Mr. Moeller was an Economist at Citibank from 1979 to 1984. He also analyzed pricing behavior in the metals industry for the Council on Wage and Price Stability in Washington, D.C. In 1999, Mr. Moeller received the award for most accurate forecast from the Forecasters' Club of New York. From 1990 to 1992 he was President of the New York Association for Business Economists. Mr. Moeller earned an M.B.A. in Finance from Fordham University, where he graduated in 1987. He holds a Bachelor of Arts in Economics from George Washington University.
More Economy in Brief


