 Global| Oct 02 2007
Weekly U.S. Chain Store Sales Remained Low
by:Tom Moeller
|in:Economy in Brief
Summary
The International Council of Shopping Centers (ICSC)-UBS reported that chain store sales showed no change last week from the prior period. That followed declines of roughly 1.0% during each of the prior two consecutive weeks. The [...]
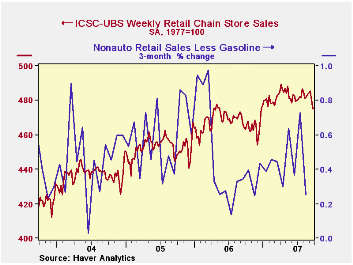
The ICSC-UBS retail chain-store sales index is constructed using the same-store sales (stores open for one year) reported by 78 stores of seven retailers: Dayton Hudson, Federated, Kmart, May, J.C. Penney, Sears and Wal-Mart.
The leading indicator of chain store sales from ICSC-UBS rose 0.4% (0.8% y/y) after a 0.2% decline during the prior week.The U.S. Consumption Boom and Trade Deficit from the Federal Reserve Bank of St. Louis is available here.
| ICSC-UBS (SA, 1977=100) | 09/29/07 | 09/22/07 | Y/Y | 2006 | 2005 | 2004 |
|---|---|---|---|---|---|---|
| Total Weekly Chain Store Sales | 475.5 | 4475.5 | 2.7% | 3.3% | 3.6% | 4.7% |
by Louise Curley October 2, 2007
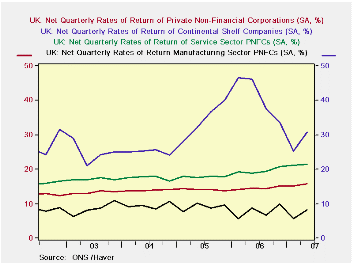
Corporate profitability in the United Kingdom continued to rise in the second quarter of this year. The net rate of return for all private nonfinancial corporations was a record 15.7%, up from 15.1% in the first quarter. (The net rate of return is defined as the ratio of net operating surplus to net capital employed.) The first chart shows the net rates of return for all private nonfinancial corporations, and for the continental shelf companies and those engaged in the manufacturing and service industries. The continental shelf companies are those engaged in the exploration for and production of oil and natural gas in the UK continental shelf. The continental shelf companies have the highest rates of return, next are those of the service companies and lowest and most volatile are those of the manufacturing companies.
In terms of profits, the service companies rank the highest. Since not all of the underlying data are available on a quarterly basis but are on an annual basis, the latter can be used to get some idea of the relative importance of each sector in the economy. In 2006, total net operating surplus amounted to 171.2 billion pounds. Of this total, the continental shelf companies accounted for about 12% and the non continental shelf companies, 88%. The service sector accounted for 76% and the manufacturing sector, 10%. The 2% discrepancy is due to the fact that the noncontinental shelf total includes data on companies in construction, electricity and gas supply, agricultural, mining and quarrying that are not shown separately.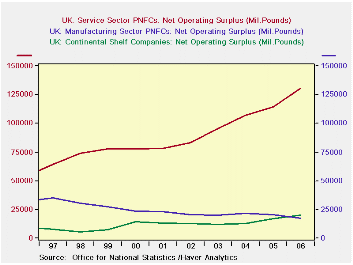
The manufacturing sector has steadily been losing ground to the service sector and for the first time its net operating profit was below that of the continental shelf companies in 2006, as can be seen in the second chart.
Data on the profitability of UK corporations can be found in the National Accounts section of Haver's UK data base.
| UK PROFITABILITY NET RATES OF RETURNS (Percent) | Q2 07 | Q1 07 | Q4 06 | Q3 06 | 2006 | 2005 | 2004 | 2003 |
|---|---|---|---|---|---|---|---|---|
| All Nonfinancial Corps. | 15.7 | 15.1 | 15.2 | 14.4 | 14.6 | 14.1 | 13.9 | 13.3 |
| Continental Shelf Corps. | 30.7 | 25.3 | 33.7 | 37.6 | 41.0 | 34.2 | 25.1 | 24.9 |
| Non Continental Shelf Corps. | 15.1 | 14.7 | 14.4 | 13.4 | 13.4 | 13.2 | 13.4 | 12.7 |
| Service Corps. | 21.4 | 21.2 | 20.8 | 19.4 | 19.6 | 17.9 | 17.5 | 17.2 |
| Manufacturing Corps. | 8.4 | 5.6 | 10.0 | 6.7 | 7.8 | 9.1 | 9.5 | 8.5 |
by Robert Brusca October 2, 2007
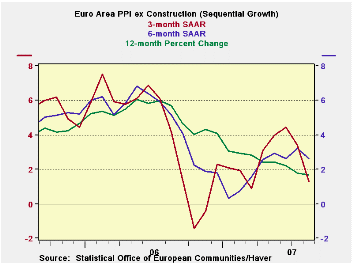
The Euro Area's year-over-year PPI excluding construction continues to head lower, while the six-month measure has seen some steady pressure and recent quasi-plateauing. But the three-month PPI is heading strongly lower. On balance, the Euro area PPI seems to be well-behaved.
The trends are well-behaved across components as well. Only consumer goods prices at the producer level are showing any acceleration in the recent three-months among major categories. Capital good prices are decelerating as are intermediate and energy goods. Manufacturing as a whole shows prices decelerating and the PPI ex-energy is also decelerating. The EMU PPI is well contained.
At the country level, Germany and Italy show the same sort of compliant patterns in their respective PPIs. The EU’s UK demonstrates some flare up in the overall PPI but still shows a PPI ex energy with decelerating trends. These are encouraging trends but this is not the ECB’s prime inflation measure. That one, the HICP, has been showing some pressure lately. But the lack of pressure at the PPI level is still good news – at least through August.
| Euro Area and UK PPI Trends | ||||||
|---|---|---|---|---|---|---|
| M/M | SAAR | |||||
| Euro Area 13 | Aug-07 | Jul-07 | 3-Mo | 6-MO | Yr/Yr | Y/Y Yr Ago |
| Total ex Construction | 0.1% | 0.3% | 1.7% | 3.2% | 1.7% | 5.7% |
| Excl Energy | 0.2% | 0.2% | 2.5% | 3.2% | 2.9% | 3.6% |
| Capital Goods | 0.0% | 0.1% | 0.6% | 0.9% | 1.6% | 1.6% |
| Consumer Goods | 0.5% | 0.4% | 4.4% | 3.3% | 2.3% | 1.9% |
| Intermediate & Capital Goods | 0.1% | 0.1% | 1.3% | 3.0% | 3.3% | 4.6% |
| Energy | -0.7% | 0.4% | -1.2% | 3.3% | -2.2% | 12.6% |
| MFG | 0.1% | 0.3% | 2.4% | 4.8% | 2.2% | 4.0% |
| Germany | 0.1% | -0.1% | 0.7% | 1.7% | 1.0% | 5.9% |
| PPI ex Energy | 0.3% | 0.1% | 2.2% | 2.8% | 2.6% | 3.0% |
| Italy | 0.1% | 0.3% | 2.0% | 3.7% | 1.9% | 6.6% |
| PPI ex Energy | 0.3% | 0.2% | 2.1% | 3.2% | 3.1% | 4.1% |
| UK | -0.6% | 0.7% | 2.6% | -2.3% | -0.1% | 8.4% |
| PPI ex Energy | 0.2% | 0.4% | 2.5% | 2.7% | 3.0% | 3.0% |
| Euro area 13 Harmonized PPI excluding Construction | ||||||
| The EA 13 countries are Austria, Belgium, Finland, France, Germany, Greece, Ireland, Italy, Luxembourg, the Netherlands, Portugal, Slovenia and Spain. | ||||||

Tom Moeller
AuthorMore in Author Profile »Prior to joining Haver Analytics in 2000, Mr. Moeller worked as the Economist at Chancellor Capital Management from 1985 to 1999. There, he developed comprehensive economic forecasts and interpreted economic data for equity and fixed income portfolio managers. Also at Chancellor, Mr. Moeller worked as an equity analyst and was responsible for researching and rating companies in the economically sensitive automobile and housing industries for investment in Chancellor’s equity portfolio. Prior to joining Chancellor, Mr. Moeller was an Economist at Citibank from 1979 to 1984. He also analyzed pricing behavior in the metals industry for the Council on Wage and Price Stability in Washington, D.C. In 1999, Mr. Moeller received the award for most accurate forecast from the Forecasters' Club of New York. From 1990 to 1992 he was President of the New York Association for Business Economists. Mr. Moeller earned an M.B.A. in Finance from Fordham University, where he graduated in 1987. He holds a Bachelor of Arts in Economics from George Washington University.
More Economy in Brief


