 Global| Jan 23 2007
Weekly Chain Store Sales Ticked Up, January Firmest Since 1999
by:Tom Moeller
|in:Economy in Brief
Summary
The International Council of Shopping Centers (ICSC)-UBS survey indicated that chain store sales last week ticked 0.1% higher after no change the prior week. The seeming lethargy of these gains, however, belies the greater strength of [...]
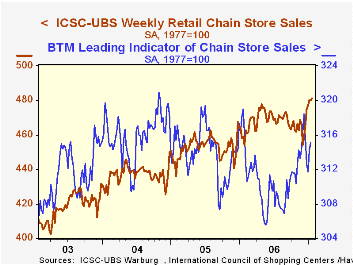
The ICSC-UBS retail chain-store sales index is constructed using the same-store sales (stores open for one year) reported by 78 stores of seven retailers: Dayton Hudson, Federated, Kmart, May, J.C. Penney, Sears and Wal-Mart.
The leading indicator of chain store sales from ICSC-UBS also showed strength and rose 0.3% after a 0.8% increase the prior week.
| ICSC-UBS (SA, 1977=100) | 1/20/07 | 1/13/06 | Y/Y | 2006 | 2005 | 2004 |
|---|---|---|---|---|---|---|
| Total Weekly Chain Store Sales | 480.9 | 480.2 | 4.8% | 3.3% | 3.6% | 4.7% |
by Tom Moeller January 23, 2007
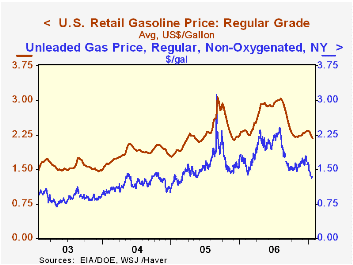
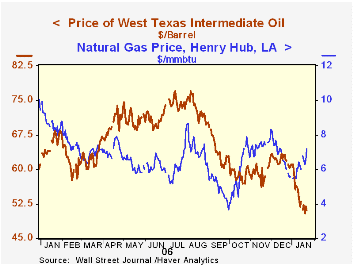 Colder temperatures have given little lift to crude oil prices which yesterday settled at $51.14 (-24.6% y/y), down more than ten dollars from the December average of $62.03.
The colder temps have, however, pushed natural gas prices higher to $7.17 per mmbtu, up nearly one third from the recent low.
Colder temperatures have given little lift to crude oil prices which yesterday settled at $51.14 (-24.6% y/y), down more than ten dollars from the December average of $62.03.
The colder temps have, however, pushed natural gas prices higher to $7.17 per mmbtu, up nearly one third from the recent low.
The latest Short-Term Energy Outlook from the U.S. Energy Information Administration is available here.
| Weekly Energy Prices | 01/22/07 | 01/15/07 | Y/Y | 2006 | 2005 | 2004 |
|---|---|---|---|---|---|---|
| US Retail Gasoline Price, Regular | $2.17 | $2.23 | -7.3% | $2.57 | $2.27 | $1.85 |
by Louise Curley January 23, 2007
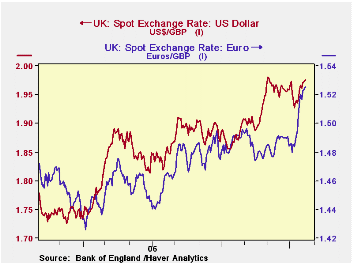
In the current survey, the British industrialists surveyed quarterly by the Confederation of Business Industries (CBI) were less pessimistic regarding the general business situation than they had been last October. They were, however, more pessimistic regarding export prospects for the next twelve months. This overall impression is due in part to the volume of new orders. The percent balance on the volume of total new orders over the past three month rose from -5% to 10% and expectations for the next 3 months are for an even higher balance of 15%. The respondents to the survey see more improvement in domestic orders than in export orders, both for the past three months and for the next three month as can be seen in the table below. Part of the reason for the dampening of export expectations is the strengthening of the pound against the dollar and the euro as can be seen in the first chart.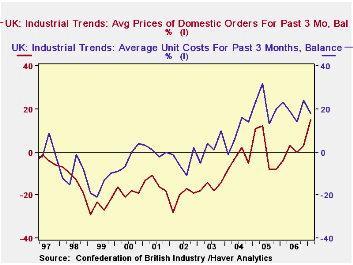
One of the most notable details of the current survey was the increase in the balance between those raising prices over the past three months and those lowering them. The percent balance was 15%, an increase of 12 percentage points from the 3% of the October survey and the highest since July, 1995. At the same time, the balance between those experiencing higher costs and those experiencing lower costs was 18%, down from 24% in the October survey.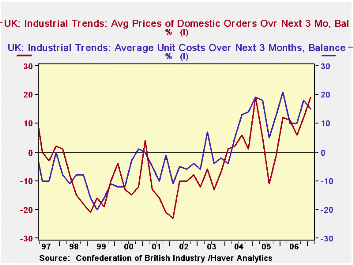
As a result of these trends, the excess of costs over prices was the smallest recorded over the past 10 years as can be seen in the second chart. For the next three months, 19% more respondents expect prices to rise than to fall and 15% more expect costs to rise than to fall. This is the first time since the first quarter of 2004, that the percent balance of those expecting price increases in the three months ahead will exceed the percent balance of those expecting cost increases, as can be seen in the third chart.
These trends auger well for profits, but they raise concerns for inflation and the possibility of further interest rate rises. The December inflation rate of 3.0% prompted the unexpected rise in the Bank of England's core interest rate from 5.00% to 5.25% on January 11, 2007.
| CBI INDUSTRIAL SURVEY (% Balances) | Q1 07 | Q4 06 | Q1 06 | Q/Q dif | Y/Y dif | 2006 | 2005 | 2004 |
|---|---|---|---|---|---|---|---|---|
| Optimism General Business Situation | -7 | -10 | -14 | 3 | 7 | -8 | -19 | 7 |
| Optimism Export Situation Next 12 mos | -2 | 1 | -5 | -3 | 3 | 1 | -6 | 7 |
| Prices past 3 mos | 15 | 3 | -4 | 12 | 19 | 1 | 2 | -4 |
| Costs past 3 mos | 18 | 24 | 23 | -6 | -5 | 20 | 22 | 9 |
| Prices next 3 mos | 19 | 12 | 12 | 7 | 7 | 10 | 3 | 3 |
| Costs next 3 mos | 15 | 18 | 21 | -3 | -6 | 15 | 14 | 7 |
| Total Orders past 3 mos | 10 | -5 | -8 | 15 | 18 | -2 | -11 | 9 |
| Total Orders next 3 mos | 15 | 3 | -2 | 12 | 17 | 4 | 1 | 8 |
| Export orders past 3 mos | 2 | -1 | -5 | 3 | 7 | -1 | -7 | 1 |
| Export orders next 3 mos | 6 | 3 | -2 | 3 | 8 | 4 | -2 | 4 |
| Domestic orders past 3 mos | 7 | -11 | -15 | 18 | 22 | -8 | -15 | 5 |
| Domestic orders next 3 mos | 8 | 0 | -9 | 8 | 17 | 1 | -2 | 7 |

Tom Moeller
AuthorMore in Author Profile »Prior to joining Haver Analytics in 2000, Mr. Moeller worked as the Economist at Chancellor Capital Management from 1985 to 1999. There, he developed comprehensive economic forecasts and interpreted economic data for equity and fixed income portfolio managers. Also at Chancellor, Mr. Moeller worked as an equity analyst and was responsible for researching and rating companies in the economically sensitive automobile and housing industries for investment in Chancellor’s equity portfolio. Prior to joining Chancellor, Mr. Moeller was an Economist at Citibank from 1979 to 1984. He also analyzed pricing behavior in the metals industry for the Council on Wage and Price Stability in Washington, D.C. In 1999, Mr. Moeller received the award for most accurate forecast from the Forecasters' Club of New York. From 1990 to 1992 he was President of the New York Association for Business Economists. Mr. Moeller earned an M.B.A. in Finance from Fordham University, where he graduated in 1987. He holds a Bachelor of Arts in Economics from George Washington University.
More Economy in Brief


