 Global| Feb 06 2007
Weekly Chain Store Sales Recover
by:Tom Moeller
|in:Economy in Brief
Summary
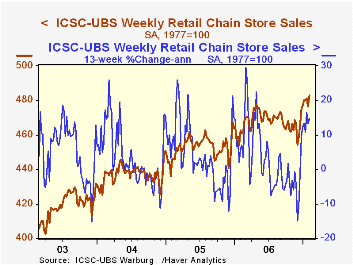
With a 1.3% increase last week, the International Council of Shopping Centers (ICSC)-UBS survey indicated that chain store sales recovered from the sharp 0.9% decline at the end of January. The lift enabled the new month to begin 0.7% [...]

The ICSC-UBS retail chain-store sales index is constructed using the same-store sales (stores open for one year) reported by 78 stores of seven retailers: Dayton Hudson, Federated, Kmart, May, J.C. Penney, Sears and Wal-Mart.
The leading indicator of chain store sales from ICSC-UBS rose 0.7% after the 1.2% drop the prior week and so far for January is down 0.3%.Stock Market Dispersion and Unemployment from the Federal Reserve Bank of St. Louis is available here.
| ICSC-UBS (SA, 1977=100) | 2/03/07 | 1/27/06 | Y/Y | 2006 | 2005 | 2004 |
|---|---|---|---|---|---|---|
| Total Weekly Chain Store Sales | 482.8 | 476.4 | 4.3% | 3.3% | 3.6% | 4.7% |
by Tom Moeller February 6, 2007

Expected Inflation Near and Far from the Federal Reserve Bank of St. Louis can be found here.
| Weekly Energy Prices | 02/05/07 | 01/29/07 | Y/Y | 2006 | 2005 | 2004 |
|---|---|---|---|---|---|---|
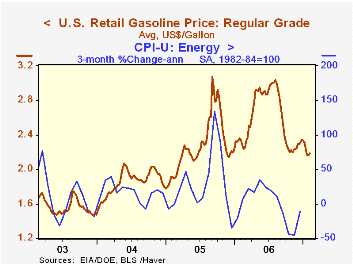
| US Retail Gasoline Price, Regular | $2.19 | $2.17 | -6.4% | $2.57 | $2.27 | $1.85 |
by Louise Curley February 6, 2007

Japan's Cabinet Office released today preliminary diffusion and composite indexes of business cyclical developments for December. Final figures will be released on February 16, one day after the release of data for the fourth quarter GDP.
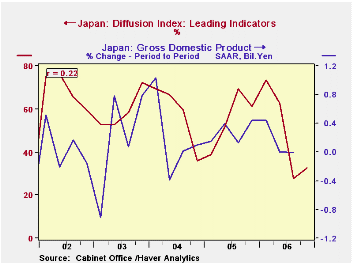
Diffusion indexes aggregate the direction of changes in selected series that indicate a phase of the business cycle--leading, coincident and lagging. (The leading, coincident and lagging series are shown in the Composite Indexes in the Indexes of Business Cycles in Haver's JAPAN data base.) A diffusion index number below 50% is a sign that the economy may slow in three to six months. The leading diffusion index is not, however, by itself, a particularly good forecaster of Gross National Product. In the first chart the leading diffusion index aggregated on a quarterly basis is shown with GDP. The correlation between the two series is a mere 22%.
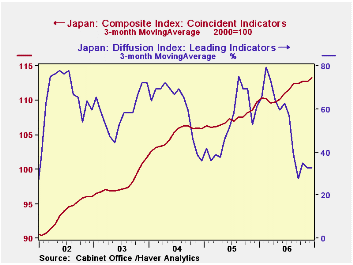
Composite indexes aggregate the percentage changes in the selected series to indicate the volume of economic activity. When the composite coincident index is rising, the economic cycle is considered to be in the expansion phase, and when declining, in the contraction phase.The Cabinet Office suggests that because of the volatility in all the series, that one should use three month moving averages. On this basis the year to year change in the composite coincident index appears to be a better indicator of the year to year changes in GDP as can be seen in the second chart, where the correlation between the two series is 77%. .The leading diffusion index is signaling caution. Although the index increased in December to 25% from 18.2% in November, it marked the second month that the index was below 50%. Except for October when the index was 54.5%, the index has been below 50% in last half of 2006 and on a three month average basis, the index has been below 50 since July, 2006. The composite coincident index, however, suggests that the economy is still in the expansion phase. Although this indicator dipped slightly in December to 113.4 from 113.5, on a three month average basis, it rose from 112.8 in November to 113.3 in December. The three month moving averages of the leading diffusion index and the coincident composite index are shown in the third chart. Even on a three month moving average, the leading diffusion index is still highly volatile, suggesting that its use in forecasting GDP may entail a wider band of error than the use of the composite coincident indicator.
| JAPAN: DIFFUSION AND COMPOSITE INDEXES |
Dec 06 | Nov 06 | Dec 05 | M/M DIF | Y/Y DIF | 2006 | 2005 | 2004 |
|---|---|---|---|---|---|---|---|---|
| Diffusion Indexes (%) | ||||||||
| Leading | 25.0 | 18.2 | 66.7 | 6.8 | -11.7 | 49.1 | 55.2 | 58.0 |
| Coincident | 61.1 | 65.0 | 90.9 | -3.9 | -29.8 | 66.4 | 71.6 | 61.4 |
| Lagging | 50.0 | 60.0 | 66.7 | -10. | -16.7 | 64.3 | 72.2 | 77.8 |
| Composite Indexes (2000=100) | ||||||||
| Leading | 102.5 | 104.2 | 104.8 | -1.7 | -2.3 | 105.5 | 102.8 | 103.0 |
| Coincident | 113.4 | 113.5 | 110.9 | -0.1 | 7.5 | 111.6 | 107.7 | 105.2 |
| Lagging | 124.3 | 126.2 | 120.5 | -1.9 | 3.8 | 124.6 | 119.7 | 114.2 |
Tom Moeller
AuthorMore in Author Profile »Prior to joining Haver Analytics in 2000, Mr. Moeller worked as the Economist at Chancellor Capital Management from 1985 to 1999. There, he developed comprehensive economic forecasts and interpreted economic data for equity and fixed income portfolio managers. Also at Chancellor, Mr. Moeller worked as an equity analyst and was responsible for researching and rating companies in the economically sensitive automobile and housing industries for investment in Chancellor’s equity portfolio. Prior to joining Chancellor, Mr. Moeller was an Economist at Citibank from 1979 to 1984. He also analyzed pricing behavior in the metals industry for the Council on Wage and Price Stability in Washington, D.C. In 1999, Mr. Moeller received the award for most accurate forecast from the Forecasters' Club of New York. From 1990 to 1992 he was President of the New York Association for Business Economists. Mr. Moeller earned an M.B.A. in Finance from Fordham University, where he graduated in 1987. He holds a Bachelor of Arts in Economics from George Washington University.
More Economy in Brief
 Global| Feb 05 2026
Charts of the Week: Balanced Policy, Resilient Data and AI Narratives
by:Andrew Cates


