 Global| Nov 04 2008
Vacant Auto Showrooms; U.S. Light Vehicle Sales Lowest Since 1983
by:Tom Moeller
|in:Economy in Brief
Summary
Auto showrooms were notably quiet last month as U.S. sales of light vehicles fell to 10.56 million units (AR). The figure was the lowest level since February, 1983 according to the Autodata Corporation and Ward's Automotive News [...]
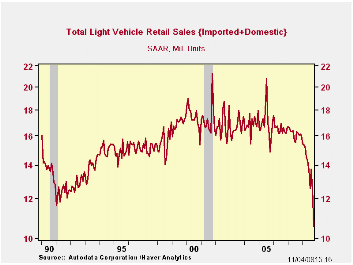
Auto showrooms were notably quiet last month as U.S. sales of light vehicles fell to 10.56 million units (AR). The figure was the lowest level since February, 1983 according to the Autodata Corporation and Ward's Automotive News (Seasonal adjustment of the figures is provided by the U.S. Bureau of Economic Analysis). The 15.5% m/m decline in October sales pulled them more than one-third below the same month's level of last year. Sales for the year so far have averaged a 13.76M annual selling rate, down 15.0% from the first ten months of last year. The level of October vehicle sales was quite a bit weaker than Consensus expectations for sales of 12.0M.
Sales of domestically made light vehicles
fell nearly 20% m/m to 7.65M units (-36.7% y/y). The decline came on
top of their 8.3% drop during September and year-to-date, sales were
down 17.0% from the first ten months of last year. Domestically made
light truck sales suffered further from higher gasoline prices and they
fell 22.0% (-42.5% y/y). Truck sales this year were 23.2% lower than
during the first ten months of 2007. Sales of U.S. made cars declined a
less severe 15.2% from September. As drivers continued to shift
purchases to relatively fuel efficient vehicles, car sales were down
8.2% versus the first ten months of last year.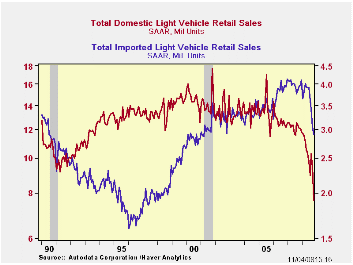
Sales of imported light vehicles were not immune to the developing recession in the U.S. Last month they fell 6.1% (-26.5% y/y) to 2.91M units on top of their 10.5% decline during September. The latest was the lowest level since October of 2002.Sales of imported autos actually rose m/m. The 0.3% rise to 1.95M units left them off just 3.7% from the first ten months of last year, but the latest was their lowest sales rate since January 2006. Year-to-date, sales were down 4.0% from the first ten months of 2007.Sales of imported light truck sales were not, however, immune to the effect from higher gasoline prices and they fell 14.4% m/m (-35.5% y/y). Sales were down 17.5% from the first ten months of last year.
Import's share of the U.S. light vehicle market recovered their loss of the prior two months and rose to 27.5%. (Imported vehicles are those produced outside the U.S. and do not include vehicles with the nameplate of a foreign manufacturer produced within the U.S.)
Who really made your car? from the Federal Reserve Bank of Chicago is available here.
Economy in lower gear through 2008 also from the Federal Reserve Bank of Chicago can be found here.
| Light Vehicle Sales (SAAR, Mil. Units) | October | September | Y/Y | 2007 | 2006 | 2005 |
|---|---|---|---|---|---|---|
| Total | 10.56 | 12.50 | -34.2% | 16.17 | 16.54 | 16.96 |
| Autos | 5.55 | 6.19 | -26.1 | 7.58 | 7.77 | 7.65 |
| Domestic | 3.60 | 4.25 | -28.5 | 5.07 | 5.31 | 5.40 |
| Imported | 1.95 | 1.94 | -21.1 | 2.51 | 2.45 | 2.25 |
| Light Trucks | 5.01 | 6.31 | -41.3 | 8.60 | 8.78 | 9.32 |
| Domestic | 4.05 | 5.19 | -42.5 | 7.12 | 7.42 | 8.12 |
| Imported | 0.96 | 1.12 | -35.5 | 1.48 | 1.37 | 1.20 |
by Tom Moeller November 4, 2008
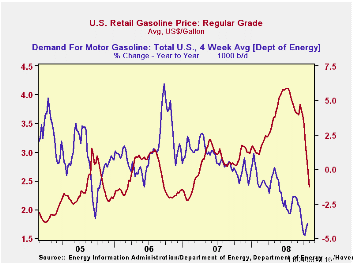
The retail price for a gallon of regular gasoline fell by another twenty five cents last week. According to the U.S. Department of Energy survey, the price decline came on top of a twenty five cent drop during the prior week and the cost of $2.40 was the lowest since February of 2007. Prices have now fallen roughly $1.75 per gallon, or by forty percent, since their peak early this past July. The latest decline was accompanied by a drop in the average price for all grades of gasoline to $2.46 per gallon.
Yesterday, the spot market price for a gallon of regular gasoline fell another sixteen cents from last week's average to $1.41. In futures trading the November contract closed down further at $1.36 per gallon.
Weekly gasoline prices can be found in Haver's WEEKLY database. Daily prices are in the DAILY database.
The slowing of U.S. economic growth and the relatively high
price for gas has reduced demand for gasoline by
4.0% y/y, according to the U.S. Department of Energy. This was the
largest y/y drop since late 1995 (the latest four weeks versus the same
four weeks last year). The demand for all petroleum products also has
softened, falling 7.8% y/y.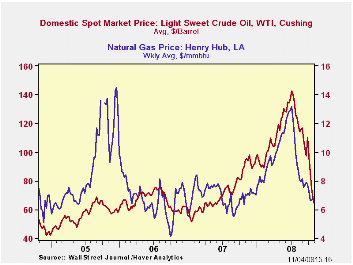
These DOE figures are available in Haver's OILWKLY database.
The price for a barrel of West Texas Intermediate crude oil fell further last week to an average $65.68 per barrel, down by more than one-half from the high in July of $145.66. In futures trading yesterday, the two-month price for crude oil was $64.59 per barrel.
Last week ,prices for natural gas at $6.43 per mmbtu were near their lowest level since October of last year. The average price this month was nearly one-half below the high for natural gas prices in early-July of $13.19/mmbtu.
| Weekly Prices | 11/03/08 | 10/27/08 | Y/Y | 2007 | 2006 | 2005 |
|---|---|---|---|---|---|---|
| Retail Regular Gasoline ($ per Gallon) | 2.40 | 2.66 | -20.3% | 2.80 | 2.57 | 2.27 |
| Light Sweet Crude Oil, WTI ($ per bbl.) | 65.68 | 68.18 | -30.4% | 72.25 | 66.12 | 56.60 |
by Louise Curley November 4. 2008
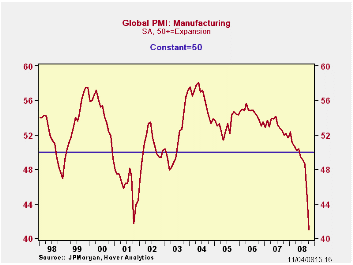 After two sharp declines in September and October the global
PMI (Purchasing Managers Index) for manufacturing reached a record low
of 40.98 (50+ = expansion)in October, as can be seen in the first chart.
After two sharp declines in September and October the global
PMI (Purchasing Managers Index) for manufacturing reached a record low
of 40.98 (50+ = expansion)in October, as can be seen in the first chart.
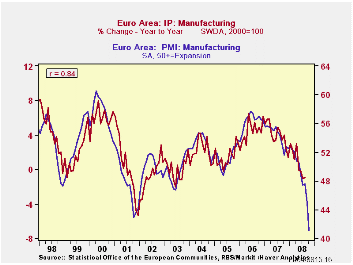
The PMI is a good predictor of manufacturing production. As an example, the second chart shows the relationship between the PMI for the Euro Area and the year-over- year changes in its manufacturing production. The correlation, R, between the two series is .84, the R2 is .706 indicating that the PMI explains about 70% of the variation in manufacturing production.
 The Global PMI is based on the responses of 26 countries that
account for 83% of world manufacturing production. The latest figures
suggest that no country appears to be immune to the global slowdown in
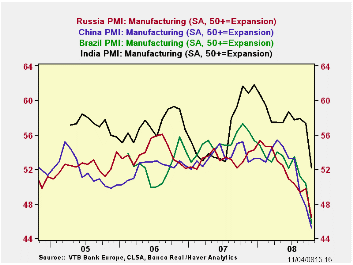
manufacturing production. In the October data there is only one country
still in the expansion phase, that is, India, with an index of 52.19.
but it has been declining from a somewhat higher base than some of the
other countries. The third chart compares India with three other
emerging markets--China, Russia and Brazil.
The Global PMI is based on the responses of 26 countries that
account for 83% of world manufacturing production. The latest figures
suggest that no country appears to be immune to the global slowdown in
manufacturing production. In the October data there is only one country
still in the expansion phase, that is, India, with an index of 52.19.
but it has been declining from a somewhat higher base than some of the
other countries. The third chart compares India with three other
emerging markets--China, Russia and Brazil.
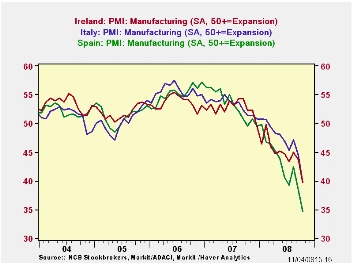
The countries showing the lowest PMIs, and hence, the greatest
contraction, are Ireland, 39.69, Italy, 39.67 and Spain, 34.60, These
last are shown in the fourth chart.
| PURCHASING MANAGERS' INDEXES | Brazil | China | India | Italy | Ireland | Spain | Russia | Singapore | Japan | UK | Euro Area |
|---|---|---|---|---|---|---|---|---|---|---|---|
| October 2008 | 45.68 | 45.23 | 52.19 | 39.67 | 39.69 | 34.60 | 46.45 | 45.80 | 42.22 | 41.49 | 41.10 |
by Robert Brusca November 4. 2008
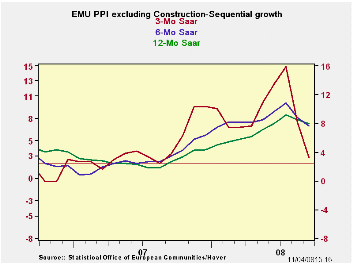
The EMU PPI fell by 0.2% in September after dropping by 0.5% in August. WITH those two drops the three-month growth in the total ex-construction PPI is STILL +2.5% saar. The year/year PPI is at 7.9%. In between these the 6-month PPI has been blunted to 7.5% but its growth rate too is still horrific. Core PPI inflation is dropping and is ‘down’ to 3.2%. But this report is uniformly being interpreted as paving the way for an ECB rate cut. But of the four major EU nations we show the core PPI trends for in the table below, only Italy is below the ceiling for inflation that the ECB imposes on the HICP headline. And this ECB is a SINGLE MANDATE central bank. It has an inflation tolerance, period; it has no commitment to growth. But even with the inflation picture this bad, the ECB is widely believed to be on the brink of a second rate cut.
This shows us how far the ECB has come. Some European Finance ministers continue to marginalize the risk. In Germany there is a certain pretending in play that its banks and its economy are not hurt by as much. But Europe’s connection to central and Eastern Europe reinforce their sense of involvement with the stuff that is going wrong. In addition there is the leverage and all the fancy financial assets banks piled on their balance sheets. All of them did it.
In Europe the economic numbers are still diving. Today it is auto registrations that look so weak. The EU Commission has cuts its growth numbers to two marginally negative numbers over the next two quarters. Time will tell if that forecast is overly optimistic. The fact that the ECB is cutting rates with the inflation picture still as poor as it is, tells a much clearer story of what Europe really fears and how much.
| Euro Area and UK PPI Trends | ||||||
|---|---|---|---|---|---|---|
| M/M | Saar | |||||
| Euro Area-15 | Sep-08 | Aug-08 | 3-Mo | 6-MO | Yr/Yr | Y/Y Yr Ago |
| Total ex Construction | -0.2% | -0.5% | 2.5% | 7.5% | 7.9% | 2.7% |
| Excl Energy | 0.0% | 0.2% | 3.2% | 3.8% | 4.1% | 3.1% |
| Capital Goods | 0.1% | 0.1% | 2.1% | 2.3% | 2.2% | 1.6% |
| Consumer Goods | -0.1% | 0.2% | 1.1% | 1.6% | 3.3% | 2.9% |
| Intermediate & Capital Goods | 0.0% | 0.2% | 4.0% | 4.9% | 4.5% | 3.1% |
| Energy | -0.9% | -2.4% | -0.3% | 19.1% | 20.3% | 1.7% |
| MFG | -0.5% | -0.6% | -1.8% | 4.5% | 5.6% | 3.4% |
| Germany | 0.3% | -0.6% | 6.8% | 9.6% | 8.3% | 1.5% |
| Gy Ex Energy | 0.1% | 0.2% | 3.9% | 3.9% | 3.6% | 2.5% |
| Italy | -0.5% | 0.0% | 0.9% | 5.9% | 7.3% | 3.5% |
| It Ex Energy | -0.1% | 0.2% | 1.3% | 3.2% | 3.9% | 3.2% |
| UK | -0.2% | -2.4% | -8.3% | 16.2% | 19.4% | 4.6% |
| UK Ex Energy | 0.3% | 0.0% | 3.2% | 9.1% | 8.2% | 3.3% |
| Euro Area 15 Harmonized PPI excluding Construction. | ||||||
| The EA 15 countries are Austria, Belgium, Cyprus, Finland, France, Germany, Greece, Ireland, Italy, Luxembourg, Malta, the Netherlands, Portugal, Slovenia and Spain. | ||||||

Tom Moeller
AuthorMore in Author Profile »Prior to joining Haver Analytics in 2000, Mr. Moeller worked as the Economist at Chancellor Capital Management from 1985 to 1999. There, he developed comprehensive economic forecasts and interpreted economic data for equity and fixed income portfolio managers. Also at Chancellor, Mr. Moeller worked as an equity analyst and was responsible for researching and rating companies in the economically sensitive automobile and housing industries for investment in Chancellor’s equity portfolio. Prior to joining Chancellor, Mr. Moeller was an Economist at Citibank from 1979 to 1984. He also analyzed pricing behavior in the metals industry for the Council on Wage and Price Stability in Washington, D.C. In 1999, Mr. Moeller received the award for most accurate forecast from the Forecasters' Club of New York. From 1990 to 1992 he was President of the New York Association for Business Economists. Mr. Moeller earned an M.B.A. in Finance from Fordham University, where he graduated in 1987. He holds a Bachelor of Arts in Economics from George Washington University.
More Economy in Brief


