 Global| Jul 28 2006
US GDP Growth Slowed
by:Tom Moeller
|in:Economy in Brief
Summary
U.S. real GDP growth last quarter slowed to 2.5% (AR) from 3.7% during the prior four quarters and the figure fell short of Consensus expectations for a 3.0% advance. Much of the disappointment stemmed from a meager 2.7% advance in [...]
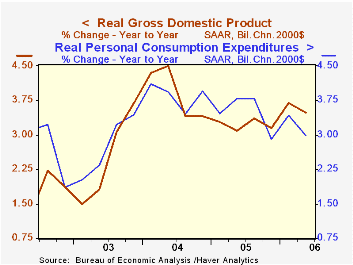
U.S. real GDP growth last quarter slowed to 2.5% (AR) from 3.7% during the prior four quarters and the figure fell short of Consensus expectations for a 3.0% advance.
Much of the disappointment stemmed from a meager 2.7% advance in business investment. It reflected a 1.0% (+6.9% y/y) decline in spending on equipment & software as well as a 21.6% (-1.0% y/y) drop in spending on transportation equipment.
Growth in real personal consumption expenditures also slowed to 2.5% from 3.4% during the prior four quarters. Durables spending growth fell 0.5% (3.3% y/y) due to a 3.1% (-4.6% y/y) drop in motor vehicles & parts.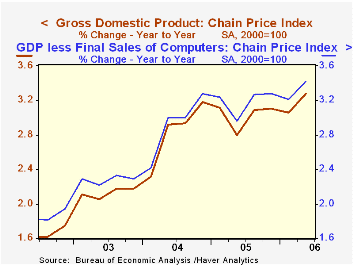
Residential investment fell for the third straight quarter. The 6.3% decline (-0.2% y/y) knocked 0.4 percentage points out of 2Q growth in real GDP.
Final sales to domestic purchasers overall grew just 1.6% (3.0% y/y) following four quarters of 3.7% growth. Earlier growth rates were revised down but the effect on GDP was limited by upward revisions to inventories.Last quarter, inventories added 0.4 percentage points to GDP growth.In addition, improvement in net exports added 0.3 percentage points to growth as exports grew 3.3% (7.4% y/y) and imports inched up 0.2% (6.1% y/y).
The GDP chain price index grew 3.3%, the same as during 1Q. Less final sales of computers, the chain price index grew 3.5% (3.5% y/y).
| Chained 2000$, % AR | 2Q '06 | 1Q '06 | Y/Y | 2005 | 2004 | 2003 |
|---|---|---|---|---|---|---|
| GDP | 2.5% | 5.6% | 3.5% | 3.2% | 3.9% | 2.5% |
| Inventory Effect | 0.4% | -0.0% | 0.6% | -0.3% | 0.4% | 0.0% |
| Final Sales | 2.1% | 5.6% | 2.9% | 3.5% | 3.5% | 2.5% |
| Foreign Trade Effect | 0.3% | -0.0% | -0.1% | -0.1% | -0.5% | -0.3% |
| Domestic Final Demand | 1.6% | 5.4% | 3.0% | 3.6% | 4.0% | 2.8% |
| Chained GDP Price Index | 3.3% | 3.3% | 3.3% | 3.0% | 2.8% | 2.1% |
by Tom Moeller July 28, 2006
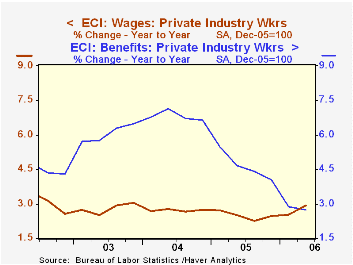
The employment cost index for private industry workers increased 0.8% during 2Q, about as expected, after an unrevised 0.6% 1Q increase.
The 2Q increase was the fastest in over a year.
Wages & salaries grew at the quickest pace (0.9%) since late 2003 as factory sector wages grew 0.8% (NSA, 2.7% y/y). That was the best quarterly gain since 3Q04. Service-producing industries' wage also grew a firm 0.8% (2.7% y/y) which was stable with 1Q.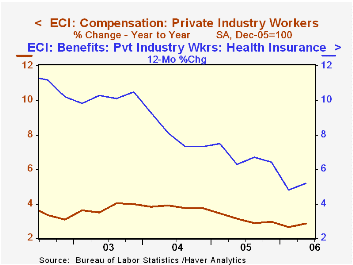
Benefit costs grew 0.7% after a depressed 1Q increase.
The 12-month gain in health insurance benefits picked up slightly to 5.2%.
To view the latest release with all the industry detail visit BLS site.
| ECI- Private Industry Workers | 2Q '06 | 1Q '06 | Y/Y | 2005 | 2004 | 2003 |
|---|---|---|---|---|---|---|
| Compensation | 0.8% | 0.6% | 2.8% | 3.0% | 3.7% | 4.0% |
| Wages & Salaries | 0.9% | 0.7% | 2.9% | 2.5% | 2.7% | 3.0% |
| Benefit Costs | 0.7% | 0.4% | 2.7% | 4.0% | 6.6% | 6.5% |
by Tom Moeller July 28, 2006
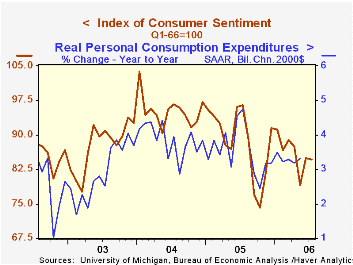
Consumer sentiment late this month recovered from the decline early in July. For the full month the volatility left sentiment off just 0.2% from June at 84.7, according to the University of Michigan. Consensus expectations had been for a full month reading of 83.0.
During the last ten years there has been a 77% correlation between the level of consumer sentiment and the y/y change in real consumer spending.
The reading of current economic conditions eased just 1.4% following a 9.3% rise during June. The index of current personal finances fell 2.7% (-9.8% y/y) and perceived buying conditions for large household goods slipped 0.6% (-8.1% y/y).
Expectations for the economy rose 0.7% led by a 1.7% (-8.3% y/y) rise in expected personal finances. Expected 12 month business conditions fell 1.1% (-22.3% y/y) but 5 year expected conditions improved.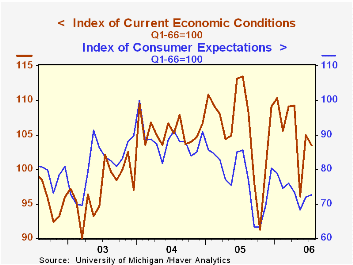
Consumers' opinion about gov't economic policy improved a sharp 10.8% m/m (-10.9% y/y), the first monthly increase since March while expected inflation during the next year fell sharply to 3.8%, its lowest since February. The five to ten year expected rate of inflation also fell to 3.2%, its lowest in over a year.
The University of Michigan survey is not seasonally adjusted.The mid-month survey is based on telephone interviews with 250 households nationwide on personal finances and business and buying conditions. The survey is expanded to a total of 500 interviews at month end.
| University of Michigan | July | July (Prelim.) | June | Y/Y | 2005 | 2004 | 2003 |
|---|---|---|---|---|---|---|---|
| Consumer Sentiment | 84.7 | 83.0 | 84.9 | -14.0% | 88.6 | 95.2 | 87.6 |
| Current Conditions | 103.5 | 100.8 | 105.0 | -11.2% | 105.9 | 105.6 | 97.2 |
| Expectations | 72.5 | 71.6 | 72.0 | -16.3% | 77.4 | 88.5 | 81.4 |
by Carol Stone July 28, 2006
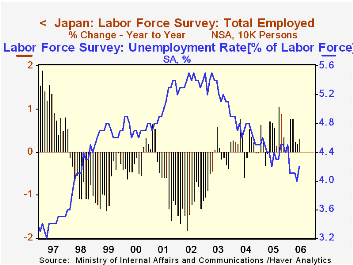
Japanese stocks rose and bonds fell after a plethora of economic data that traders deemed favorable today. June consumer prices showed an eighth straight month of year-on-year increase in the most popular measure, the total less fresh food, which was up 0.6%. Retail sales rose 0.4% from a year ago. The labor market, which we feature here, moderated somewhat, but perhaps analysts saw this as a pause in an otherwise increasingly robust picture.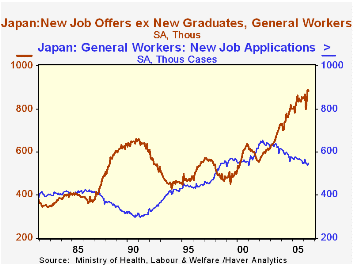
Employment fell 160,000 after advancing 270,000 in May. However, the June figure was up 0.3% from a year ago, a bit more growth than the 0.2% of May and April. The unemployment rate rose to 4.2% from May's 4.0%. The latter rate was the lowest in a little over eight years.
One of the Japanese news services, Mainichi, called our attention to the set of interesting data on job openings and placements from the Ministry of Health, Labor and Welfare. [The aggregate labor force survey is published by the Ministry of Internal Affairs and Communications.] In June, the number of people registered as needing work was 2.15 million, the smallest since late 1997; during the recent long period of economic stress in Japan, this number peaked at 2.805 million in January 2002. The other side of this coin is job openings, which totaled 2.327 million in June, compared with a cycle low of 1.174 million in May 1999. The number of openings was smaller than the number of applicants until just this past December.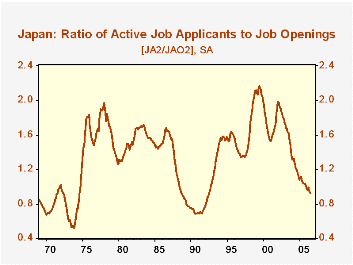
The ratio of these "active" openings to "active" applicants was 1.08 in June, suggesting that conditions are positive for employment to continue growing. Remarkably, this is the highest such value since July 1992, almost 14 years. At its worst, the relationship between applicants and openings saw at least 2 applicants for every opening; this prevailed from autumn 1998 throughout 1999. Presently, additional data on marginal changes in the labor market show how much conditions have changed: new job openings are far larger than the number of new job applicants. Their June ratio was 1.62, following May's 1.65. The last time this indicator of marginal changes in labor market conditions was this high was May of 1992. Its low was 0.80, also in May 1999.
| Japan: SA | June 2006 | May 2006 | Apr 2006 | June 2005 | 2005 | 2004 | 2003 |
|---|---|---|---|---|---|---|---|
| Employment (millions) | 63.75 | 63.91 | 63.64 | 63.55 | 63.57 | 63.29 | 63.15 |
| Change (thous.) / Yr-to-Yr % Change* | -160 | +270 | -50 | 0.3% | 0.4% | 0.2% | -0.2% |
| Unemployment Rate (%) | 4.2% | 4.0% | 4.1% | 4.2% | 4.4% | 4.7% | 5.3% |
| Active Applications (thous.) | 2,150 | 2,156 | 2,181 | 2,294 | 2,272 | 2,367 | 2,595 |
| New Applications (thous.) | 547 | 538 | 545 | 570 | 567 | 589 | 626 |
| Active Openings (thous.) | 2,327 | 2,309 | 2,266 | 2,191 | 2,167 | 1,958 | 1,672 |
| New Openings (thous.) | 884 | 889 | 839 | 863 | 831 | 761 | 673 |
| Ratio: Active Openings to Applications | 1.08 | 1.07 | 1.04 | 0.96 | 0.95 | 0.83 | 0.64 |
| Ratio: New Openings to Applications | 1.62 | 1.65 | 1.54 | 1.51 | 1.47 | 1.29 | 1.08 |

Tom Moeller
AuthorMore in Author Profile »Prior to joining Haver Analytics in 2000, Mr. Moeller worked as the Economist at Chancellor Capital Management from 1985 to 1999. There, he developed comprehensive economic forecasts and interpreted economic data for equity and fixed income portfolio managers. Also at Chancellor, Mr. Moeller worked as an equity analyst and was responsible for researching and rating companies in the economically sensitive automobile and housing industries for investment in Chancellor’s equity portfolio. Prior to joining Chancellor, Mr. Moeller was an Economist at Citibank from 1979 to 1984. He also analyzed pricing behavior in the metals industry for the Council on Wage and Price Stability in Washington, D.C. In 1999, Mr. Moeller received the award for most accurate forecast from the Forecasters' Club of New York. From 1990 to 1992 he was President of the New York Association for Business Economists. Mr. Moeller earned an M.B.A. in Finance from Fordham University, where he graduated in 1987. He holds a Bachelor of Arts in Economics from George Washington University.
More Economy in Brief


