 Global| May 26 2005
US GDP Growth Revised Up, Corporate Profit Growth Down
by:Tom Moeller
|in:Economy in Brief
Summary
US real GDP growth last quarter was revised up to 3.5% (AR) due to a halving of the subtraction from deterioration in the foreign trade deficit. Consensus expectations had been for a 3.7% advance. Growth in corporate profits (w/IVA & [...]
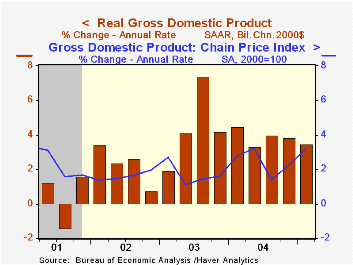
US real GDP growth last quarter was revised up to 3.5% (AR) due to a halving of the subtraction from deterioration in the foreign trade deficit. Consensus expectations had been for a 3.7% advance.
Growth in corporate profits (w/IVA & CCA) slowed to 4.5% (13.8% y/y) from 13.5% in 4Q04. The slowdown was due to a 0.8% (+17.6% y/y) decline in US nonfinancial corporate earnings. Growth in financial sector earnings also slowed by two thirds to 11.6% (13.9% y/y) while earnings from abroad rose 11.2% (2.2% y/y), the strongest gain since late 2003.
Profit margins fell for the first quarter in two years though they remained higher than during all of last year.
The drag on US output growth from a larger foreign trade deficit was reduced to 0.7 percentage points as growth in real imports was lowered to 9.1% (9.4% y/y) from 14.7%. Export growth was bumped up to 7.2% (5.9% y/y) from 7.0%.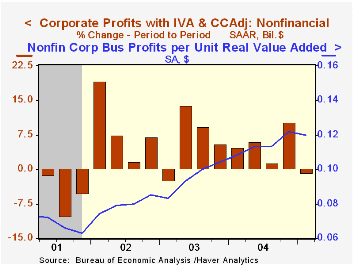
The contribution to GDP growth from faster inventory accumulation was lowered to 0.8 percentage points. Nevertheless, the $25.9B rate of accumulation in the factory sector was the fastest since late 1999.
Domestic demand growth was left unrevised at 3.2%. Growth in business investment was lowered slightly to a weak 3.5% (10.8% y/y). That was offset by an upward revision to consumer spending to 3.6% (3.6% y/y) and residential building to 8.8% (7.4% y/y).
The chain price index was unrevised at 3.2%. The price index for domestic demand also was unrevised at 2.9%.
| Chained 2000$, % AR | 1Q '05 (Prelim.) | 1Q '05 (Advance) | 4Q '04 | Y/Y | 2004 | 2003 | 2002 |
|---|---|---|---|---|---|---|---|
| GDP | 3.5% | 3.1% | 3.8% | 3.7% | 4.4% | 3.0% | 1.9% |
| Inventory Effect | 0.8% | 1.2% | 0.5% | 0.3% | 0.4% | -0.1% | 0.4% |
| Final Sales | 2.7% | 1.9% | 3.4% | 3.4% | 4.0% | 3.1% | 1.4% |
| Foreign Trade Effect | -0.7% | -1.5% | -1.4% | -0.6% | -0.4% | -0.3% | -0.7% |
| Domestic Final Demand | 3.2% | 3.2% | 4.5% | 4.0% | 4.4% | 3.4% | 2.1% |
| Chained GDP Price Index | 3.2% | 3.3% | 2.3% | 2.5% | 2.2% | 1.8% | 1.7% |
by Tom Moeller May 26, 2005
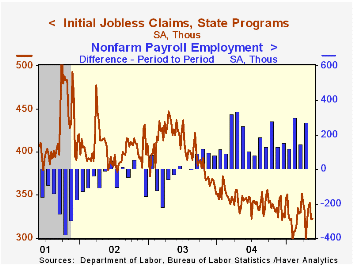
Initial claims for unemployment insurance nudged 1,000 higher last week to 323,000 and the prior week's drop was lessened slightly to 19,000. Consensus expectations had been for 325,000 claims.
During the last ten years there has been a (negative) 75% correlation between the level of initial claims for unemployment insurance and the monthly change in payroll employment. There has been a (negative) 65% correlation with the level of continuing claims.
The four week moving average of initial claims was little changed at 300,500 (-2.7% y/y).
Continuing claims for unemployment insurance fell 22,000 and the prior week was revised down slightly.
The insured unemployment rate held at 2.0% for the fifth consecutive week.
| Unemployment Insurance (000s) | 05/21/05 | 05/14/05 | Y/Y | 2004 | 2003 | 2002 |
|---|---|---|---|---|---|---|
| Initial Claims | 323 | 322 | -6.1% | 343 | 402 | 404 |
| Continuing Claims | -- | 2,574 | -12.7% | 2,926 | 3,531 | 3,570 |
by Tom Moeller May 26, 2005
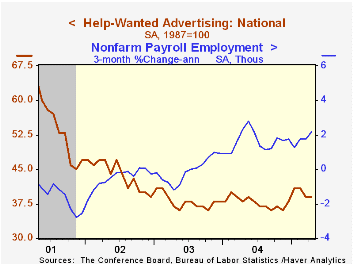
The April Index of Help-Wanted Advertising from the Conference Board remained at 39. It fell in March from 41 during the prior two months.
During the last ten years there has been a 65% correlation between the level of help-wanted advertising and the three month change in non-farm payrolls.
The proportion of labor markets with rising want-ad volume improved to a still low 31% following the evaporation to 10% in March.
The Conference Board surveys help-wanted advertising volume in 51 major newspapers across the country every month.
The latest help wanted report from the Conference Board is available here.
| Conference Board | April | March | April '04 |
|---|---|---|---|
| National Help Wanted Index | 39 | 39 | 38 |

Tom Moeller
AuthorMore in Author Profile »Prior to joining Haver Analytics in 2000, Mr. Moeller worked as the Economist at Chancellor Capital Management from 1985 to 1999. There, he developed comprehensive economic forecasts and interpreted economic data for equity and fixed income portfolio managers. Also at Chancellor, Mr. Moeller worked as an equity analyst and was responsible for researching and rating companies in the economically sensitive automobile and housing industries for investment in Chancellor’s equity portfolio. Prior to joining Chancellor, Mr. Moeller was an Economist at Citibank from 1979 to 1984. He also analyzed pricing behavior in the metals industry for the Council on Wage and Price Stability in Washington, D.C. In 1999, Mr. Moeller received the award for most accurate forecast from the Forecasters' Club of New York. From 1990 to 1992 he was President of the New York Association for Business Economists. Mr. Moeller earned an M.B.A. in Finance from Fordham University, where he graduated in 1987. He holds a Bachelor of Arts in Economics from George Washington University.
More Economy in Brief


