 Global| Sep 19 2006
US Flow of Funds: Households' Net Worth Stable
by:Tom Moeller
|in:Economy in Brief
Summary
The net worth of the US household sector inched up just 0.1% last quarter versus 1Q'06 to $53.3 trillion. The gain totaled, however, 7.9% versus the second quarter of last year. On the asset side of the ledger, total assets of [...]
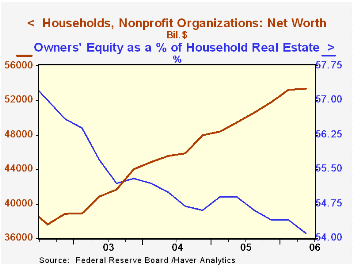
The net worth of the US household sector inched up just 0.1% last quarter versus 1Q'06 to $53.3 trillion. The gain totaled, however, 7.9% versus the second quarter of last year.
On the asset side of the ledger, total assets of households and nonprofit organizations rose 8.4% y/y. Households' ownership of real estate rose 10.5% in value to over $20 trillion. Mutual fund share holdings rose 18.0% though the value of corporate equities held directly by households fell 1.5%. The value of money market shares rose 14.6% after a 6.0% gain last year and Treasury security holdings rose 20.6% y/y in value after a 2.2% decline during 2005.
Credit market debt outstanding held by all sectors of the economy grew 8.9%, about steady with last year's pace. The federal government's debt grew 5.9% y/y but U.S. households increased their borrowing at nearly twice that rate, 11.0%. Home mortgage liabilities grew 12.6% y/y after 14% gains during the prior three years. Consumer credit increased 3.9% y/y, the same as last year's growth rate, but households' obligations in the form of bank loans more than doubled versus 2Q of last year and also doubled during all of 2005.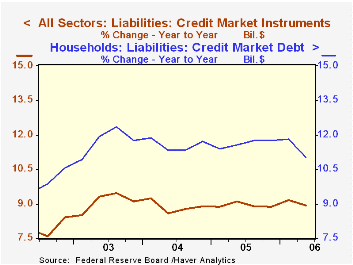
Borrowing by nonfinancial corporations continued strong, up 11.9%, following double digit growth during 2004 & 2005. During the last forty years there has been a 40% correlation between the y/y growth in corporate borrowing and the growth in nonresidential fixed investment.
Foreign sector holdings of US assets continued to surge, by 13.3% y/y. That was stable with last year's growth rate but it raised foreigners' ownership of U.S. credit outstanding to 14.1% versus 10.0% ten years ago.
Intangible Capital and Economic Growth from the Federal Reserve Board is available here.
| Flow of Funds (Y/Y Chg.) | % of Total | 2Q'06 | 1Q'06 | 2005 | 2004 | 2003 |
|---|---|---|---|---|---|---|
| Total Credit Market Debt Outstanding | 8.9% | 9.2% | 8.9% | 8.9% | 9.1% | |
| Federal Government | 12% | 5.9% | 6.5% | 7.0% | 9.0% | 10.9% |
| Households | 27% | 11.0% | 11.8% | 11.7% | 11.7% | 11.8% |
| Nonfinancial Corporate Business | 14% | 6.8% | 6.1% | 5.5% | 3.6% | 2.2% |
| Financial Sectors | 32% | 9.1% | 8.9% | 8.2% | 8.1% | 9.9% |
| Net Worth: Households & Nonprofit Organizations (Trillions) | $53.3 | $53.3 | $51.8 | $48.0 | $44.0 | |
| Tangible Assets: Households | $26.3 | $25.8 | $25.2 | $22.5 | $20.4 | |
| Financial Assets: Households | $39.8 | $39.9 | $38.8 | $36.4 | $33.5 |
by Tom Moeller September 20, 2006
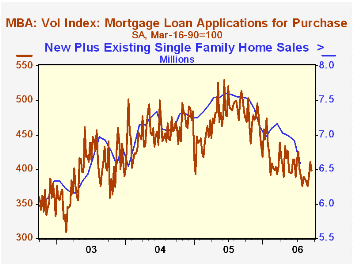
After two weeks of respectable gain, the number of mortgage applications for purchase fell last week by 3.0%, according to the Mortgage Bankers Association. For the month so far, applications in September are 4.2% above the August average which fell 3.5% from July.
During the last ten years there has been a 58% correlation between the y/y change in purchase applications and the change in new plus existing single family home sales.
Overall mortgage applications nevertheless rose 2.0% last week and the gain lifted the average level this month 4.3% above August.
Applications to refinance surged 9.5% after three weeks of slight decline. The average level of refis in September is up 4.2% from August which surged 13.3% m/m from July.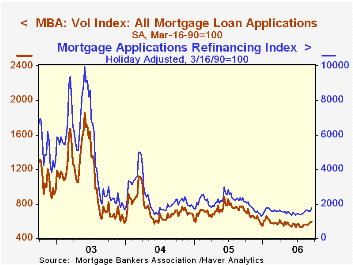
The effective interest rate on a conventional 30-year mortgage rose to 6.59 from 6.53% the week earlier and has averaged 6.55% this month versus 6.64% in August. The peak for 30 year financing was 7.08% late in June. The rate on 15-year financing also rose w/w to 6.30% and the peak rate was 6.75%. Interest rates on 15 and 30 year mortgages are closely correlated (>90%) with the rate on 10 year Treasury securities.
During the last ten years there has been a (negative) 79% correlation between the level of applications for purchase and the effective interest rate on a 30-year mortgage.
The Mortgage Bankers Association surveys between 20 to 35 of the top lenders in the U.S. housing industry to derive its refinance, purchase and market indexes. The weekly survey accounts for more than 40% of all applications processed each week by mortgage lenders. Visit the Mortgage Bankers Association site here.
| MBA Mortgage Applications (3/16/90=100) | 09/15/06 | 09/08/06 | Y/Y | 2005 | 2004 | 2003 |
|---|---|---|---|---|---|---|
| Total Market Index | 595.8 | 584.2 | -22.8% | 708.6 | 735.1 | 1,067.9 |
| Purchase | 397.9 | 410.2 | -20.5% | 470.9 | 454.5 | 395.1 |
| Refinancing | 1,748.7 | 1,597.0 | -25.7% | 2,092.3 | 2,366.8 | 4,981.8 |
by Tom Moeller September 20, 2006
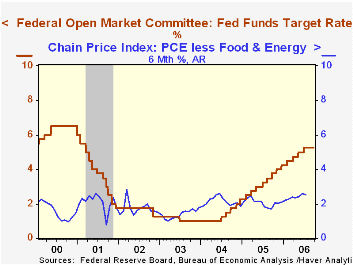
The target interest rate for Federal funds was again held steady at 5.25% at today's meeting of the Federal Open Market Committee. Voting against the decision for the second time was Richmond Federal Reserve Bank President Jeffrey M. Lacker, who preferred an increase of 25 basis points in the federal funds rate target.
The discount rate also was held steady at 6.25%.
Today's decision was widely expected by analysts.
The Fed's rationale for leaving rates unchanged indicated that "The moderation in economic growth appears to be continuing, partly reflecting a cooling of the housing market."
Need for further rate increases was stressed by the Fed. "The extent and timing of any additional firming that may be needed to address these (inflation) risks will depend on the evolution of the outlook for both inflation and economic growth, as implied by incoming information."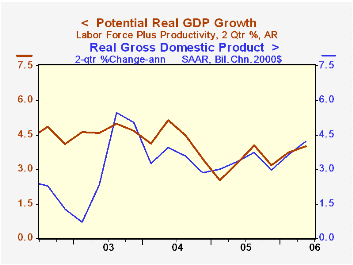
For the complete text of the Fed's latest press release please follow this link.
The accompanying chart plots the U.S. economy's actual rate of growth during the last two quarters versus its so called "potential", i.e., growth in the labor force plus the growth in labor productivity. The economy's potential for 4% growth was exceeded slightly in the first half due to the 5.6% surge in 1Q'06 growth.
Knut Wicksell: The Birth of Modern Monetary Policy from the Federal Reserve Bank of Dallas can be found here.
Modern Macroeconomics in Practice: How Theory is Shaping Policy from the Federal Reserve Bank of Minneapolis is available here.
Spain's Labor Costs Pick Up in Q2; Benefits Outstrip Wage Gainsby Carol Stone September 20, 2006
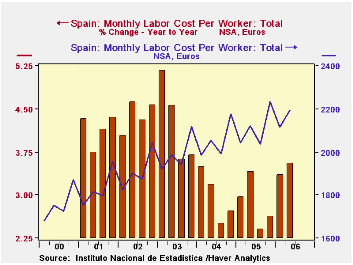
Spain's National Institute of Statistics (INE) reported on labor costs today for Q2 2006. These costs, measured as monthly compensation per worker, picked up to a 3.5% growth rate year-on-year from 3.4% in Q1 and at or near 3.0% for the previous two calendar years. The data are in a simple format: in Haver's SPAIN database, they are available in euros and an index of 2000=100, for three sectors of the economy, industry, construction and services, and for the total and two components, earnings and "other". So there are 12 numbers in each quarterly report for each the euro amount and the index level. Could such a small array be interesting? Indeed.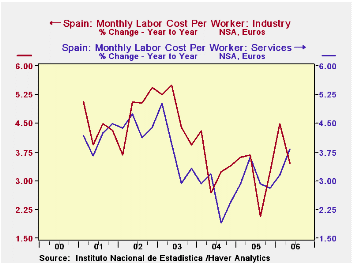
In Q2, while labor costs accelerated in total, they slowed in basic industry and construction and not by small increments. The industry sector increased 3.5% following 4.5% in Q1. Construction gained 3.9% in the latest quarter, after 4.3% in Q1. But the rapidly expanding service sector had 3.8% growth in Q2, well more than the 3.2% in Q1. So labor compensation in services gained visibly even as it slowed in more traditional sectors. However, this may have been a transitory shift, as the average annual gains over the prior five years had the reverse pattern: industry and construction both had vigorous increases, 4.1% annually for industry and 4.7% for construction, with services at 3.6%. So it's hard to tell if the old-line economy is moving to a slower trend or just pausing after sizable gains in earlier periods. In fact, if anything, these data show how consistent the service sector has been, hovering all the while in a range around 3-1/2% average yearly gains.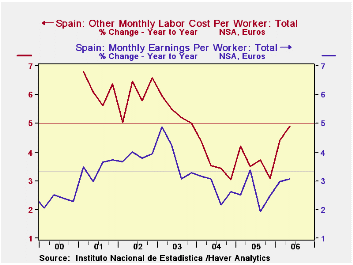
Another significant point in this little array of data concerns the split between wages and "other" labor costs. Over the period 2000-2005, earnings grew at an average annual rate of 3.3%. But other labor compensation advanced at a 5.0% pace. These costs cover the same general items referred to in the US as "supplements to wages and salaries" or "benefits": disability and unemployment, and also in Spain compensation for tools, uniforms and transportation, and similar job-related expenses. In both countries, these also cover employers' payments into the social security system. And in Spain as in the US, to continue the parallel, these "other" costs are growing as a portion of total compensation: in 2000, "other" labor costs were 24.6% of compensation in Spain and by the first half of this year, they absorbed 26.7%. For the US, comparable shares were 16.5% in 2000 and 19.3% this year.
| Spain: Monthly Labor Cost/ Worker (€, NSA) | Q2 2006 | Q1 2006 | Q2 2005 | 2005 | 2004 | 2003 | 2000 |
|---|---|---|---|---|---|---|---|
| Total | 2197 | 2114 | 2122 | 2110 | 2058 | 1992 | 1758 |
| Yr/Yr % Chg | 3.5 | 3.4 | 3.4 | 2.9 | 3.0 | 4.2 | 3.7 |
| Earnings | 1624 | 1538 | 1575 | 1560 | 1521 | 1480 | 1326 |
| Yr/Yr % Chg | 3.1 | 3.0 | 3.4 | 2.6 | 2.8 | 3.8 | 3.3 |
| "Other" | 574 | 575 | 547 | 550 | 531 | 512 | 432 |
| Yr/Yr % Chg | 4.9 | 4.4 | 3.5 | 3.6 | 3.6 | 5.4 | 5.0 |
| "Other" as % of Total | 26.1 | 27.2 | 25.8 | 26.1 | 25.9 | 25.7 | 24.6 |
| Memo: Similar US Share | 19.3 | 19.3 | 19.4 | 19.4 | 19.1 | 19.0 | 16.5 |

Tom Moeller
AuthorMore in Author Profile »Prior to joining Haver Analytics in 2000, Mr. Moeller worked as the Economist at Chancellor Capital Management from 1985 to 1999. There, he developed comprehensive economic forecasts and interpreted economic data for equity and fixed income portfolio managers. Also at Chancellor, Mr. Moeller worked as an equity analyst and was responsible for researching and rating companies in the economically sensitive automobile and housing industries for investment in Chancellor’s equity portfolio. Prior to joining Chancellor, Mr. Moeller was an Economist at Citibank from 1979 to 1984. He also analyzed pricing behavior in the metals industry for the Council on Wage and Price Stability in Washington, D.C. In 1999, Mr. Moeller received the award for most accurate forecast from the Forecasters' Club of New York. From 1990 to 1992 he was President of the New York Association for Business Economists. Mr. Moeller earned an M.B.A. in Finance from Fordham University, where he graduated in 1987. He holds a Bachelor of Arts in Economics from George Washington University.
More Economy in Brief


