 Global| Dec 06 2007
US Flow of Funds: Debt Growth Back Up Due To Financial Sector
by:Tom Moeller
|in:Economy in Brief
Summary
Credit market debt outstanding owed by all sectors of the economy grew 11.0% (AR, 9.3% y/y) during the third quarter. The increase was the strongest since 4Q 2005 and reflected broad based, strong gains in the financial sector.. [...]
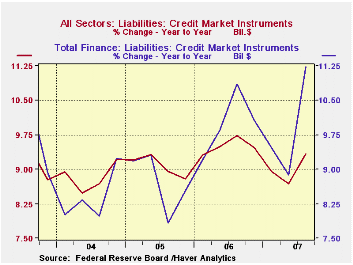
Credit market debt outstanding owed by all sectors of the economy grew 11.0% (AR, 9.3% y/y) during the third quarter. The increase was the strongest since 4Q 2005 and reflected broad based, strong gains in the financial sector..
Credit market debt owed by the financial sector zoomed at a 16.5% (11.2% y/y) annual rate which was the strongest rate of gain since early 2001. Gains at commercial banks (41.0% y/y), bank holding companies (23.2 y/y), savings institutions (-8.8% y/y) and credit unions (68.9% y/y) were well into double or triple digit rates of growth.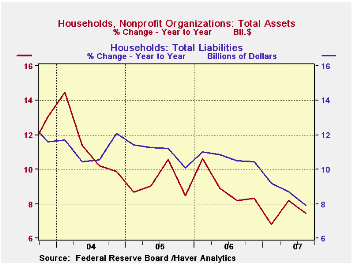
Stable was consumer credit growth which held at an 8.2% (7.8% y/y) quarterly rate of growth. Households' obligations on home mortgages grew 7.3% (8.0% y/y) which was half the growth rates seen a few years back. Conversely, credit card debt rose sharply (5.3% y/y) and the quarterly growth rate of 10.3% was the quickest since 2004. Bank loans also surged.
The net worth of the US household sector last quarter improved to a record $58.604 trillion as the dollar gain in household sector assets, which totaled 72.8 trillion, outweighed by four times the growth of liabilities which total $14.1 trillion.
Total assets of households and nonprofit organizations grew at a 4.9% rate (7.4 y/y). Households' ownership of real estate assets was much reduced to a 2.1% growth rate (4.3% y/y), the slowest rate of gain since 1993. That, however, was offset by a 6.4% (9.5% y/y) gain in financial assets led by a one-quarter (7.2% y/y) rise in the value of credit market instruments and a rise in the value of mutual fund share holdings (21.8% y/y). The value of money market shares rose by one third as assets were shifted to a safe haven (24.5% y/y).
| Flow of Funds (Y/Y Chg.) | % of Total | 3Q'07 | 2Q'07 | 2006 | 2005 | 2004 |
|---|---|---|---|---|---|---|
| Total Credit Market Debt Outstanding | -- | 9.3% | 8.7% | 9.5% | 8.8% | 9.2% |
| Federal Government | 12% | 4.3% | 3.0% | 3.9% | 7.0% | 9.0% |
| Households | 27% | 7.8% | 8.2% | 10.3% | 10.7% | 11.5% |
| Nonfinancial Corporate Business | 14% | 11.0% | 9.8% | 8.4% | 5.1% | 3.5% |
| Financial Sectors | 32% | 11.2% | 8.9% | 10.1% | 8.5% | 9.2% |
| Net Worth: Households & Nonprofit Organizations (Trillions) | -- | $58.604 | $57.979 | $56.117 | $52.061 | $48.164 |
| Tangible Assets: Households | -- | $27.484 | $27.325 | $26.671 | $25.019 | $22.464 |
| Financial Assets: Households | -- | $45.277 | $44.579 | $42.880 | $39.203 | $36.747 |

Tom Moeller
AuthorMore in Author Profile »Prior to joining Haver Analytics in 2000, Mr. Moeller worked as the Economist at Chancellor Capital Management from 1985 to 1999. There, he developed comprehensive economic forecasts and interpreted economic data for equity and fixed income portfolio managers. Also at Chancellor, Mr. Moeller worked as an equity analyst and was responsible for researching and rating companies in the economically sensitive automobile and housing industries for investment in Chancellor’s equity portfolio. Prior to joining Chancellor, Mr. Moeller was an Economist at Citibank from 1979 to 1984. He also analyzed pricing behavior in the metals industry for the Council on Wage and Price Stability in Washington, D.C. In 1999, Mr. Moeller received the award for most accurate forecast from the Forecasters' Club of New York. From 1990 to 1992 he was President of the New York Association for Business Economists. Mr. Moeller earned an M.B.A. in Finance from Fordham University, where he graduated in 1987. He holds a Bachelor of Arts in Economics from George Washington University.
More Economy in Brief


