 Global| Jan 31 2007
US 4Q GDP Growth Firmer Than Expected
by:Tom Moeller
|in:Economy in Brief
Summary
U.S. real GDP grew 3.5% (AR) last quarter. It was both the fastest growth since 1Q06 and beat Consensus expectations for a 3.0% rise. The yearend figure raised growth for the full year to 3.4%, slightly ahead of 3.2% during 2005. A [...]

U.S. real GDP grew 3.5% (AR) last quarter. It was both the fastest growth since 1Q06 and beat Consensus expectations for a 3.0% rise. The yearend figure raised growth for the full year to 3.4%, slightly ahead of 3.2% during 2005.
A 1.6 percentage point contribution to growth from an improved net export deficit was the largest contribution from foreign trade in ten years. It came due to a 2.4% (9.2% y/y) gain in exports while imports fell 3.2% (+3.1% y/y).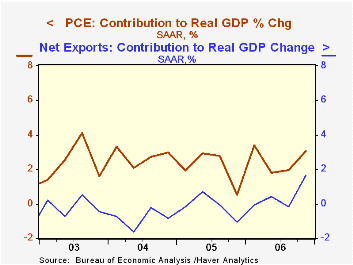 Final sales to domestic purchasers managed a respectable 2.4% gain despite a 19.2% (-12.6% y/y) drop in residential investment. That was the largest shortfall since early 1991. Personal consumption expenditures grew 4.4% (3.7% y/y) as spending on furniture & household equipment soared 15.1% (11.7% y/y).
Nonresidential fixed investment fell 0.4% (6.8% y/y) after a 10.% gain the prior quarter. Spending in each sector fell except for information processing equipment which rose a slight 1.8% (7.8% y/y) after a 10.0% jump during 3Q.
Final sales to domestic purchasers managed a respectable 2.4% gain despite a 19.2% (-12.6% y/y) drop in residential investment. That was the largest shortfall since early 1991. Personal consumption expenditures grew 4.4% (3.7% y/y) as spending on furniture & household equipment soared 15.1% (11.7% y/y).
Nonresidential fixed investment fell 0.4% (6.8% y/y) after a 10.% gain the prior quarter. Spending in each sector fell except for information processing equipment which rose a slight 1.8% (7.8% y/y) after a 10.0% jump during 3Q.
Reduced inventory accumulation subtracted 0.7 percentage points to 4Q GDP after positive contributions during the prior two quarters.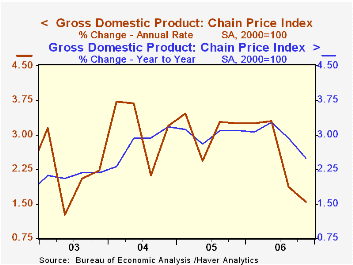
The GDP chain price index rose just 1.5%, its weakest quarterly advance since early 2003. The gain was restrained by a decline (-0.8%, +1.9% y/y) in the PCE chain price index which fell not only because of lower energy prices but lower durable goods prices as well. The services chain price index rose 3.4% (3.15 y/y), its fastest gain in a year. Less food & energy the PCE chain price index grew 2.1% (2.3% y/y).
Milton Friedman on Inflation from the Federal Reserve Bank of St. Louis is available here.
| Chained 2000$, % AR | 4Q '06 | 3Q '06 | Y/Y | 2006 | 2005 | 2004 |
|---|---|---|---|---|---|---|
| GDP | 3.5% | 2.0% | 3.4% | 3.4% | 3.2% | 3.9% |
| Inventory Effect | -0.7% | 0.1% | -0.1% | 0.3% | -0.3% | 0.4% |
| Final Sales | 4.2% | 1.9% | 3.5% | 3.1% | 3.5% | 3.5% |
| Foreign Trade Effect | 1.6% | -0.2% | 0.7% | 0.1% | -0.1% | -0.5% |
| Domestic Final Demand | 2.4% | 2.0% | 2.8% | 3.0% | 3.6% | 4.0% |
| Chained GDP Price Index | 1.5% | 1.9% | 2.5% | 2.9% | 3.0% | 2.8% |
by Tom Moeller January 31, 2007
The employment cost index for private industry workers increased 0.8% last quarter. That was less than the 1.0% rise expected by the Consensus, but during the latter part of 2006 the increases clearly accelerated versus the prior year.
For the full year 2006, the ECI grew 3.1% versus a 3.0% gain during 2005.
Wages & salaries grew 0.7% after a 0.8% 3Q rise. The full year saw an acceleration to 3.1% growth from 2.5% in 2005 and that was the fastest since 2001. Factory sector wages grew 0.7% (NSA, 2.3% y/y) and wages in the service-producing industries also grew 0.7% (3.3% y/y), the fastest in three years.
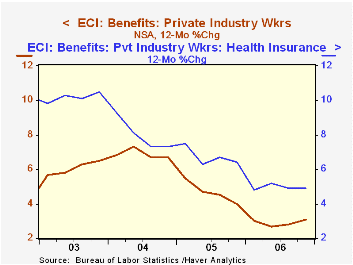
Benefit costs in private industry sustained the prior strong 3Q gain and grew 1.0% reflecting a 1.1% (3.7% y/y) surge in service industries.
The 12-month gain in health insurance benefits was stable at 4.9% but that was down from a 6.4% increase during 2005, a 7.3% rise during 2004 and a 10.5% 2003 rise.
To view the latest release with all the industry detail visit BLS site.
| ECI- Private Industry Workers | 4Q '06 | 3Q '06 | Y/Y | 2006 | 2005 | 2004 |
|---|---|---|---|---|---|---|
| Compensation | 0.8% | 0.9% | 3.1% | 3.1% | 3.0% | 3.7% |
| Wages & Salaries | 0.7% | 0.8% | 3.1% | 3.1% | 2.5% | 2.7% |
| Benefit Costs | 1.0% | 1.0% | 3.1% | 3.1% | 4.0% | 6.6% |
by Tom Moeller January 31, 2007
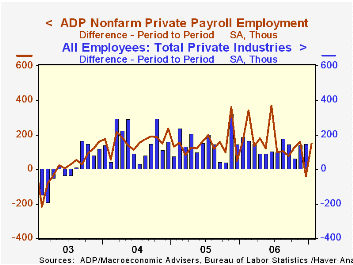
The ADP Nat'l Employment Report, reported by the payroll processor, indicated that private nonfarm payrolls rose 152,000 during January. The U.S. Bureau of Labor Statistics employment figure will be published this Friday.
Last month, ADP's measure of private nonfarm payrolls for December indicated a 40,000 decline in jobs that was followed by a BLS report that private nonfarm payrolls rose 150,000.
ADP compiled the estimate from its database of individual companies' payroll information. Macroeconomic Advisers, LLC, the St. Louis economic consulting firm, developed the methodology for transforming the raw data into an economic indicator.
According to ADP and Macro Advisers, the correlation between the monthly percentage change in the ADP estimate and that in the BLS data is 0.90.
The ADP National Employment Report data is maintained in Haver's USECON database; historical data go back to December 2000. The figures in this report cover only private sector jobs and exclude employment in the public sector, which rose an average 11,083 during the last twelve months.
The full ADP National Employment Report can be found here, and the ADP methodology is explained here.
| LAXEPA@USECON | January | December | Y/Y | 2006 | 2005 | 2004 |
|---|---|---|---|---|---|---|
| Nonfarm Private Payroll Employment (Chg.) | 152,000 | -40,000 | 1.6% | 1.8% | 1.7% | 1.3% |
by Tom Moeller January 31, 2007
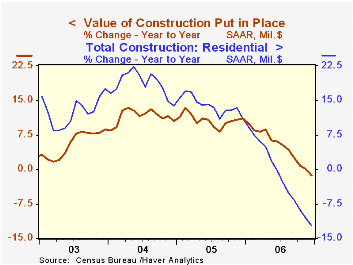
The value of construction put in place in December fell 0.4% after an upwardly revised 0.1% November uptick. Consensus expectations had been for no change.
For the full year, construction spending grew 4.8%, the weakest since 2002 after 2005's 10.7% surge.
Residential building continued it's recent rate of decline, despite warmer temperatures, and fell 1.6%. New single family building dropped 2.2% after a 3.o% slide during November and it lowered activity 22.2% below the peak this past February. Spending on improvements also slipped 0.2% (+7.8% y/y).
During the last twenty years there has been an 84% correlation between the q/q change in the value of residential building and its contribution to growth in real GDP.
Nonresidential building rose 0.9% after an unrevised 1.4% November jump. Office construction surged 1.4% (22.1% y/y) and multi-retail building soared 4.1% (21.4% y/y).
Public construction spending rose 0.6%. Spending on highways & streets, nearly one third of the value of public construction spending, fell 1.1% (+9.6% y/y).
These more detailed categories represent the Census Bureau’s reclassification of construction activity into end-use groups. Finer detail is available for many of the categories; for instance, commercial construction is shown for Automotive sales and parking facilities, drugstores, building supply stores, and both commercial warehouses and mini-storage facilities. Note that start dates vary for some seasonally adjusted line items in 2000 and 2002 and that constant-dollar data are no longer computed.
| Construction Put-in-place | December | November | Y/Y | 2006 | 2005 | 2004 |
|---|---|---|---|---|---|---|
| Total | -0.4% | 0.1% | -1.4% | 4.8% | 10.7% | 11.5% |
| Private | -0.8% | -0.5% | -4.6% | -4.6% | 12.0% | 14.3% |
| Residential | -1.6% | -1.4% | -12.5% | -1.7% | 13.9% | 18.6% |
| Nonresidential | 0.9% | 1.4% | 14.5% | 16.2% | 7.4% | 5.3% |
| Public | 0.6% | 2.2% | 10.5% | 10.2% | 6.2% | 2.8% |
by Tom Moeller January 31, 2007

The Chicago Purchasing Manager's Assn. reported that its January business barometer fell to 48.8. It was the first month the diffusion index of factory sector activity fell below the break even line of 50 since 2003.
During the last ten years there has been a 69% correlation between the index and the three month change in US factory sector industrial production.
Lower new orders and weaker employment accounted for much of the weakening while production was up.
The prices paid index dropped to to the lowest level since late 2003.During the last ten years there has been an 89% correlation between the level of the prices diffusion index and the three month change in the core PPI for intermediate good.
The latest statement from the Federal Reserve Board can be found here.
| Chicago PMI | January | December | Jan. '06 | 2006 | 2005 | 2004 |
|---|---|---|---|---|---|---|
| Chicago PMI Business Barometer Index | 48.8 | 51.6 | 58.1 | 56.8 | 60.4 | 62.8 |
by Tom Moeller January 31, 2007

The total number of mortgage applications rose 3.2%% last week, after the sharp 8.4% decline the prior week according to the Mortgage Bankers Association.
Purchase applications recovered just 1.3% after declines of 8.4% and 7.0% during the two weeks.
During the last ten years there has been a 58% correlation between the y/y change in purchase applications and the change in new plus existing single family home sales.
Applications to refinance recovered a larger 4.9%. Applications to refinance in January are 2.0% above the December average which was unchanged from November.
The effective interest rate on a conventional 30-year mortgage rose w/w to 6.50% the highest level this year and compared to the December average of 6.28%. The peak for 30 year financing was 7.08% late in June. Rates for 15-year financing also rose to 6.28%. Interest rates on 15 and 30 year mortgages are closely correlated (>90%) with the rate on 10 year Treasury securities.
During the last ten years there has been a (negative) 79% correlation between the level of applications for purchase and the effective interest rate on a 30-year mortgage.
The Mortgage Bankers Association surveys between 20 to 35 of the top lenders in the U.S. housing industry to derive its refinance, purchase and market indexes. The weekly survey covers roughly 50% of all U.S. residential mortgage applications processed each week by mortgage banks, commercial banks and thrifts. Visit the Mortgage Bankers Association site here.
| MBA Mortgage Applications (3/16/90=100) | 01/26/07 | 01/19/07 | Y/Y | 2006 | 2005 | 2004 |
|---|---|---|---|---|---|---|
| Total Market Index | 631.1 | 611.3 | 0.7% | 584.2 | 708.6 | 735.1 |
| Purchase | 408.0 | 402.7 | -6.4% | 406.9 | 470.9 | 454.5 |
| Refinancing | 1,940.2 | 1,848.8 | 11.0% | 1,634.0 | 2,092.3 | 2,366.8 |
by Carol Stone January 31, 2007

The trade deficit in Turkey shrank markedly in December. The Turkish Statistical Institute reported it at $3.08 billion, compared with $4.18 billion in November and $4.44 billion in December 2005. This was the smallest deficit since $3.01 billion in January 2006. After seasonal adjustment by Haver Analytics, the comparison is more distinct. December's $2.03 billion deficit was the lowest since $1.30 billion in November 2003.
Exports totaled $7.87 billion in the month, actually down 8.6% from November, but up 16.6% from a year ago. The largest categories were in the machinery sector, especially including transport equipment. Turkey is growing rapidly as a producer of cars and trucks. In 2006 as a whole, plants in the country produced 916,008 cars and pick-up trucks. Exports of these and other vehicles totaled $11.7 billion, making 13.8% of total goods exports. Total exports grew 15.9% last year, with "road vehicles" up 24.4%.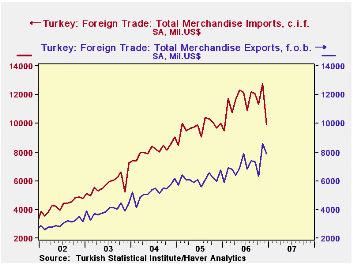
Imports were $9.90 billion, seasonally adjusted, in December, down from November by $2.9 billion or 22.5%. The unadjusted data were down 9.5% in the month. In most recent years, before seasonal adjustment, imports have spiked in December, then fallen sharply in January. So the outright decline in December's actual figure translated into a sizable cut in the seasonally adjusted result. Sources of the decline included petroleum and natural gas, chemicals, metals and transport equipment. For all of 2006, imports totaled $137.03 billion, up 17.3% from 2005.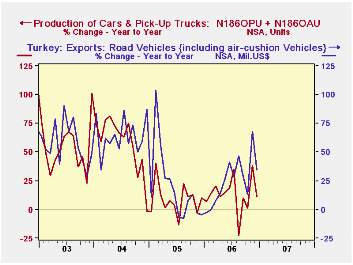
Data on Turkey from its official national sources are contained in Haver's EMERGEMA database. That rapidly expanding database now includes 18 Middle East and African countries.
| TURKEY (Mil.$) | Dec 2006 | Nov 2006 | Oct 2006 | Dec 2005 | Monthly Averages|||
|---|---|---|---|---|---|---|---|
| 2006 | 2005 | 2004 | |||||
| Trade Balance, SA | -2,026 | -4,161 | -5,043 | -3,254 | -- | -- | -- |
| NSA | -3,083 | -4,183 | -4,446 | -4,437 | -4,353 | -3,606 | -2,865 |
| Exports, SA | 7,873 | 8,618 | 6,307 | 6,769 | 7,095 | 6,123 | 5,264 |
| Yearly % Chg | +15.9 | +16.3 | +33.7 | ||||
| Imports, SA | 9,899 | 12,779 | 11,350 | 10,023 | 11,419 | 9,731 | 8,128 |
| Yearly % Chg | 17.3 | 19.7 | 40.7 |

Tom Moeller
AuthorMore in Author Profile »Prior to joining Haver Analytics in 2000, Mr. Moeller worked as the Economist at Chancellor Capital Management from 1985 to 1999. There, he developed comprehensive economic forecasts and interpreted economic data for equity and fixed income portfolio managers. Also at Chancellor, Mr. Moeller worked as an equity analyst and was responsible for researching and rating companies in the economically sensitive automobile and housing industries for investment in Chancellor’s equity portfolio. Prior to joining Chancellor, Mr. Moeller was an Economist at Citibank from 1979 to 1984. He also analyzed pricing behavior in the metals industry for the Council on Wage and Price Stability in Washington, D.C. In 1999, Mr. Moeller received the award for most accurate forecast from the Forecasters' Club of New York. From 1990 to 1992 he was President of the New York Association for Business Economists. Mr. Moeller earned an M.B.A. in Finance from Fordham University, where he graduated in 1987. He holds a Bachelor of Arts in Economics from George Washington University.
More Economy in Brief


